

Indicators
17 articles
How to read the indicators that sum up the state of the market: ForexCommand's four own composites (MRS, CTS, FSI and FOTSI) plus the classics you need to make sense of them — ATR, support and resistance, candlesticks, oscillators, correlation and the VIX. One indicator per post, explained for traders.

What are candlesticks and how do you read them?
Every candlestick sums up the fight between buyers and sellers in one shape. Learn to read its body and wicks, and the essential patterns grouped by what they signal: indecision, reversal or continuation.

What are support and resistance?
Support and resistance are the price levels where a market has repeatedly stalled or reversed — the foundation almost every other technical tool is built on.

Moving averages: what do SMA, EMA and the crossovers really tell you?
A moving average is the average price over the last N bars. That simplicity is the point — and it is why the signals built on top of it, golden and death crosses included, are so often misread.

What are momentum oscillators? RSI, stochastic and MACD
The RSI, the stochastic and the MACD measure the strength of a move, not its direction. Learn what each one measures, the signal that actually matters (divergence), and the mistake that wrecks beginners.

What is ATR (Average True Range)?
Average True Range measures how much a market typically moves — a volatility read that's one of the most practical tools for sizing positions and placing stops.

Volatility in Forex: Why ATR and Timing Beat Predicting Direction?
Most traders obsess over direction. Professionals obsess over volatility — because position size, stop placement, and whether a setup is even worth taking all depend on how much the market is actually moving.

What is the dollar index (DXY) and what does it really measure?
The DXY tracks the dollar against six currencies, but its weights were set in 1973 and never updated. What is actually inside it, and why it sometimes disagrees with the dollar in front of you.

What is the VIX and why does it move forex?
The VIX measures the movement the options market expects in US stocks. It is not a currency indicator — and yet it is one of the cleanest early warnings that risk appetite is about to turn.

What is the COT report and how do you read it?
The official count of who holds what in US currency futures. The CFTC publishes it every Friday with data from the preceding Tuesday. What each category measures?, how to read an extreme?, and how much delay it really carries?.

Currency Strength: Trade the Strongest Against the Weakest
A currency pair is a tug-of-war between two economies. The cleanest trends come from pairing the strongest currency against the weakest — and a strength meter is built to find exactly that.

What is the Forex Strength Index (FSI)?
The Forex Strength Index (FSI) is ForexCommand's proprietary market-sentiment gauge, providing a single 0-100 score to measure the overall degree of fear or greed present in the…

Currency Strength, Explained: How to Read the FOTSI Oscillator?
Every pair is two currencies pulling against each other — the FOTSI oscillator isolates each one's momentum so you can see which side is driving the move.

Currency Correlation: Why Trading EUR/USD and GBP/USD Together Doubles Your Risk?
Opening two positions can feel like diversifying. With correlated pairs, you have often just doubled the same bet — and the same risk. Here is how to see it.

The Carry Trade: What It Is and How the CTS Measures It?
The carry trade earns the interest-rate gap between two currencies — and the CTS gauges when that environment is supportive and when it is a trap.

Market Readiness Score: How to tell if conditions favor your trade before you enter?
Direction is only half the trade. Before you ask where price is going, ask whether the market is even ready to move — and learn the five factors that answer it.
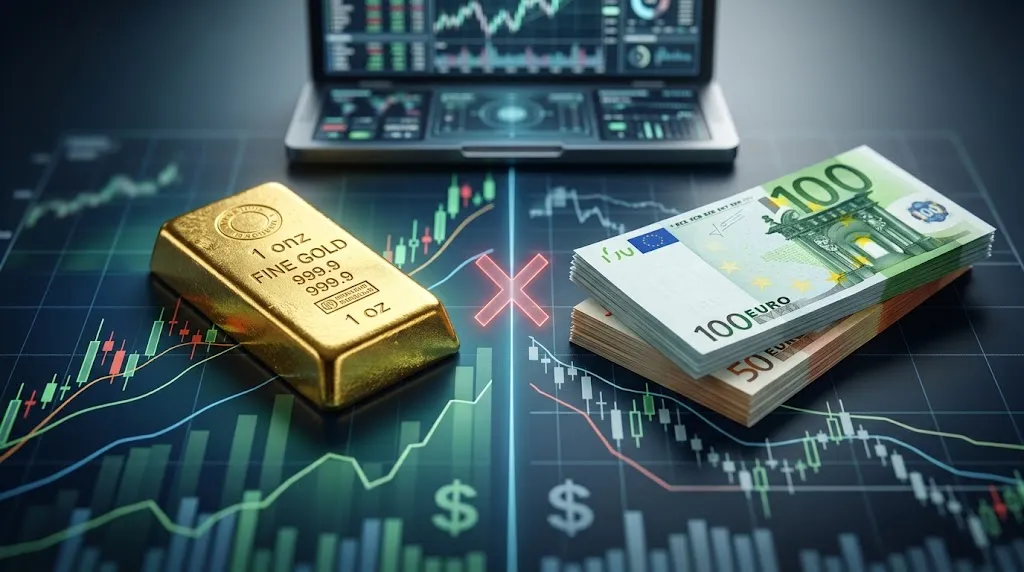
Does gold lead EUR/USD? We measured it on nearly six years of our own data
Gold and EUR/USD move together: +0.393 across nearly six years of our own data. Remove the dollar and −0.014 is all that is left. Why that huge correlation is not a signal.

Is bitcoin any use for trading forex?
Is there a real correlation between bitcoin and forex? We measured 1,449 days: it predicts nothing at any horizon, but strip the dollar out and +0.187 survives against the Australian dollar — risk appetite, not a currency effect.

