Forecast vs Previous vs Actual: How Do You Read the Economic Calendar?
Previous, forecast, actual — and a colored impact dot. What does each number on the economic calendar mean, and why is the 'surprise' (actual vs forecast) the one that moves price?

Every economic event shows three numbers and a colored impact dot. Knowing what each one means — and which one actually moves price — is the first skill a news trader needs.
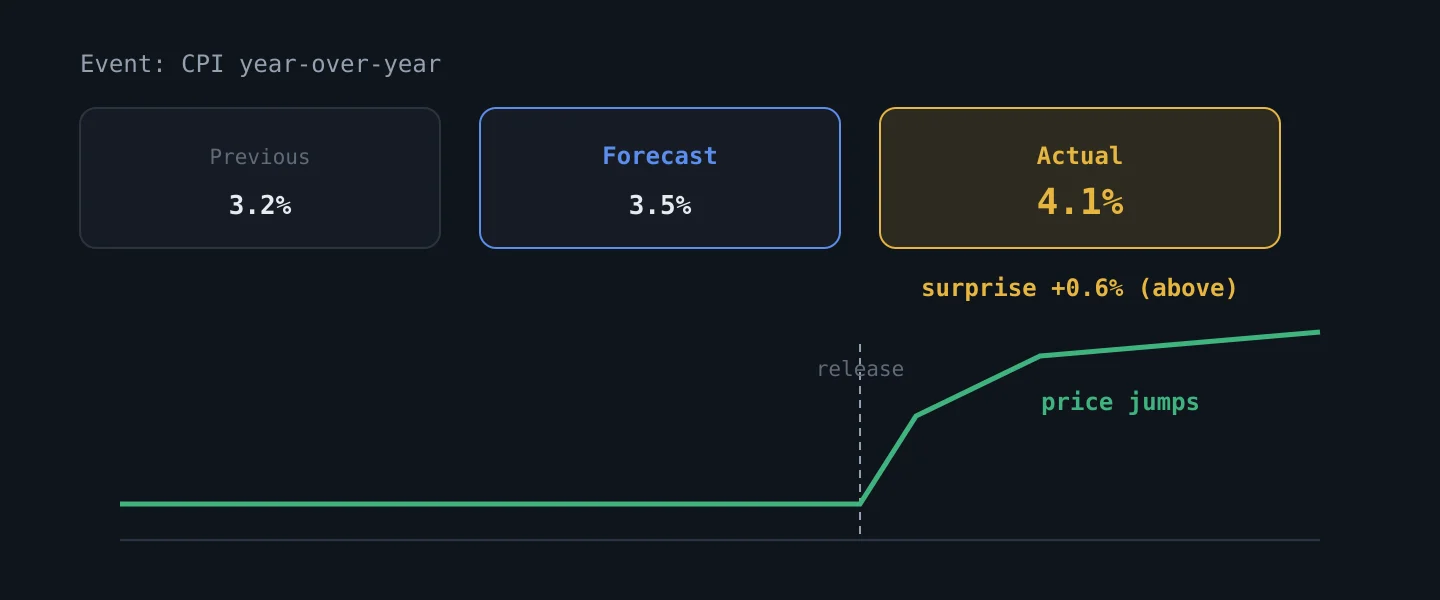
The three numbers
Open any economic calendar and each release lists three figures:
| Figure | What is it? |
|---|---|
| Previous | The last reported value for this indicator. Your baseline — is the data improving or deteriorating? |
| Forecast (consensus) | What economists, on average, expect this time. This is the bar the market has already prepared for. |
| Actual | The real figure when it's released. |
The previous sets the trend, the forecast sets the expectation, and the actual either confirms or breaks it.
The number that moves price is the surprise
Here's the part beginners miss: price reacts to the gap between actual and forecast — not to the actual on its own. That gap is the surprise. An actual that lands right on forecast is, to the market, no new information, so the reaction is usually muted. The wider the distance between actual and forecast, the bigger the potential move.
So when you read the calendar, your eye should compare actual against forecast first, and against previous second.
The impact rating
Most calendars color-code events as high, medium or low impact. That rating estimates how much market-moving potential a release has, based on how closely the central bank and traders watch it. Rate decisions, inflation (CPI/PCE) and jobs reports (like nonfarm payrolls) sit at the top; minor surveys sit at the bottom. As a rule, only high-impact events are worth structuring a trade around — and only they justify the wider spreads and volatility that come with them.
Why does every calendar name these columns differently?
Because the three numbers are a convention, not a standard. Forex Factory marks its high-impact events with a red folder icon, which is why traders say "red folder news" — it is the same impact rating described above under another name. Trading Economics splits the expectation into two columns, a market consensus and its own house forecast, which can disagree by a tenth or two.
The practical consequence is worth ten seconds before a release: know which expectation your calendar is showing you. The surprise you measure is only as good as the forecast you measured it against — and if two calendars print different forecasts, they will disagree about whether the number was a beat.
What do A, F and P mean?
They are the three columns, shortened. On compact calendars and in apps, A is the actual, F the forecast and P the previous.
News headlines use their own shorthand. A typical one reads "South Korea Q2 GDP, final, +0.6% (vs. expected +0.6%, prior +1.8%)" — expected is the forecast and prior is the previous. You will also see cons. for consensus, and R or rev. next to a previous figure that has been revised.
What do the green and red numbers mean?
Many calendars color the actual as soon as it is released, but they do not all use the same rule. On Forex Factory, a green actual is better than the forecast and a red one is worse, and the same colors on the previous mark a revision for the better or for the worse. "Better" there means better for the currency, so a jobless claims figure below forecast shows in green. Investing.com's own guide describes its colors as a number higher or lower than the forecast instead.
On most releases the two rules agree. They split on inverted indicators like jobless claims and the unemployment rate, so check which rule your calendar uses before reading a color as a signal. And the color only marks the surprise, not the market's reaction to it.
Forecast vs actual, in practice
| Outcome | What does it mean? |
|---|---|
| Actual better than forecast | A bullish surprise for that economy's currency (for most growth and inflation data). |
| Actual worse than forecast | A bearish surprise. |
| Actual in line | The move, if any, comes from the details (revisions, sub-components), not the headline. |
Direction also depends on context: in a hiking cycle, hot inflation supports the currency; in a cutting cycle, the same print can be read differently. The calendar gives you the numbers; the macro backdrop tells you how to interpret them.
Is an actual higher than forecast good for the currency?
Usually yes — but "usually" is doing real work in that sentence. For growth and inflation data (GDP, CPI, retail sales, employment), a hotter-than-expected print supports the currency, because it pushes the market to price a tighter central bank. The logic runs through interest rates, not through the number itself.
Two things flip it:
- Inverted indicators. For jobless claims or the unemployment rate, the bullish surprise is a lower number. Check what the indicator measures before deciding which direction counts as "better".
- The rate cycle. In a cutting cycle, a hot inflation print can read as bad news — it delays the relief the market was already counting on.
So the rule is not "actual above forecast means currency up". It is: does this surprise make the central bank more or less likely to keep rates high?
Which way does the pair move?
The calendar tells you what happened to one currency; the chart shows a pair. Whether the line goes up or down depends on which side of the pair that currency sits.
| A US number beats forecast and the dollar firms | What does the chart do? |
|---|---|
| GBP/USD (dollar second) | Falls |
| USD/JPY (dollar first) | Rises |
| Gold, XAU/USD (priced in dollars) | Often falls |
A pair shows how many units of the second currency one unit of the first buys, so a stronger dollar pushes GBP/USD down and USD/JPY up. Gold is quoted in dollars and tends to fall when a strong print lifts the dollar and real yields — the real-yield link explains why. "Often" matters: gold has other drivers and does not always follow the script, as the week gold fell while war raged showed.
The same logic answers a question that comes up constantly: if the actual equals the forecast but beats the previous, is that bullish or bearish for gold or GBP/USD? On the headline alone, neither — there is no surprise. Whether the gap to the previous still matters is covered below.
What is the difference between actual and previous?
The previous is the same indicator's last reading; the actual is today's. Comparing the two tells you the trend — whether the economy is speeding up or slowing down.
Comparing actual to forecast tells you the surprise, and the surprise is what moves price in the seconds after a release. A number can be far better than last month and still sell the currency off, if it landed under what the market expected.
Use both: forecast for the reaction, previous for the direction.
What does it mean if the forecast is higher than the previous?
That economists expect the indicator to speed up from its last reading; a forecast below the previous means they expect it to slow down. It does not tell you which way the currency will move when the number comes out. By release day that expectation is already in the price: it is the bar the market has prepared for.
So a forecast above the previous is not, on its own, a reason to expect a stronger or weaker currency. The reaction still comes from the surprise, how far the actual lands from that forecast.
What if the actual comes in exactly on forecast?
Then there is no surprise, and the headline reaction is usually small — but the release is not over. When the top-line number tells the market nothing it did not already know, attention moves to what sits underneath it: the revisions to earlier months, the sub-components, and, on a central bank release, the wording of the statement.
This is the one case where "compare actual to forecast first" stops helping you. Compare the actual to the previous instead: an in-line print that also marks a third consecutive month of slowing growth is information, even though it surprised nobody.
What about revisions?
The previous figure is not carved in stone. Statistical agencies revise earlier releases as more complete data arrives, and a revision can matter more than the headline actual.
A jobs report that beats forecast by a small margin while revising the two prior months sharply lower is, on balance, bad news — and the currency frequently trades it that way, which baffles anyone watching only the top-line number. The market is judging the whole trend, not today's print in isolation.
Two habits follow. Check whether a release carries revisions before you judge it, and remember that the revised previous is the one the market is now working from — not the figure you noted last month.
Why does price sometimes move the "wrong" way?
It happens often enough that it deserves an explanation rather than a shrug. Four common causes:
- The move already happened. If the market spent a week pricing a strong number, a strong number delivers nothing new. "Buy the rumour, sell the fact" is this, and it is the single most common reason a good print sells off.
- Positioning was one-sided. When everyone is already long ahead of a release, there is nobody left to buy the good news, and the unwind dominates the reaction.
- The detail contradicted the headline. A strong jobs number with weak wage growth, or hot inflation driven entirely by one volatile component, gets read past the first line.
- Something else was louder. A release does not land in a vacuum. Another country's data, a central bank speaker, or a risk event can own the session regardless of your number.
None of these make the surprise irrelevant. They mean the surprise is one input into a price that is weighing several at once.
The takeaway
Read every release as a three-part story: previous (the trend), forecast (the expectation) and actual (the result) — then judge it by the surprise, the distance between actual and forecast. Filter for high-impact events, compare actual to consensus, and you've turned a wall of numbers into a map of where price is likely to move.