What is the Market Maker Model (AMD)?
The Market Maker Model, sometimes called the AMD cycle or the "Power of 3", is a conceptual narrative explaining how large institutional players often move price through three…

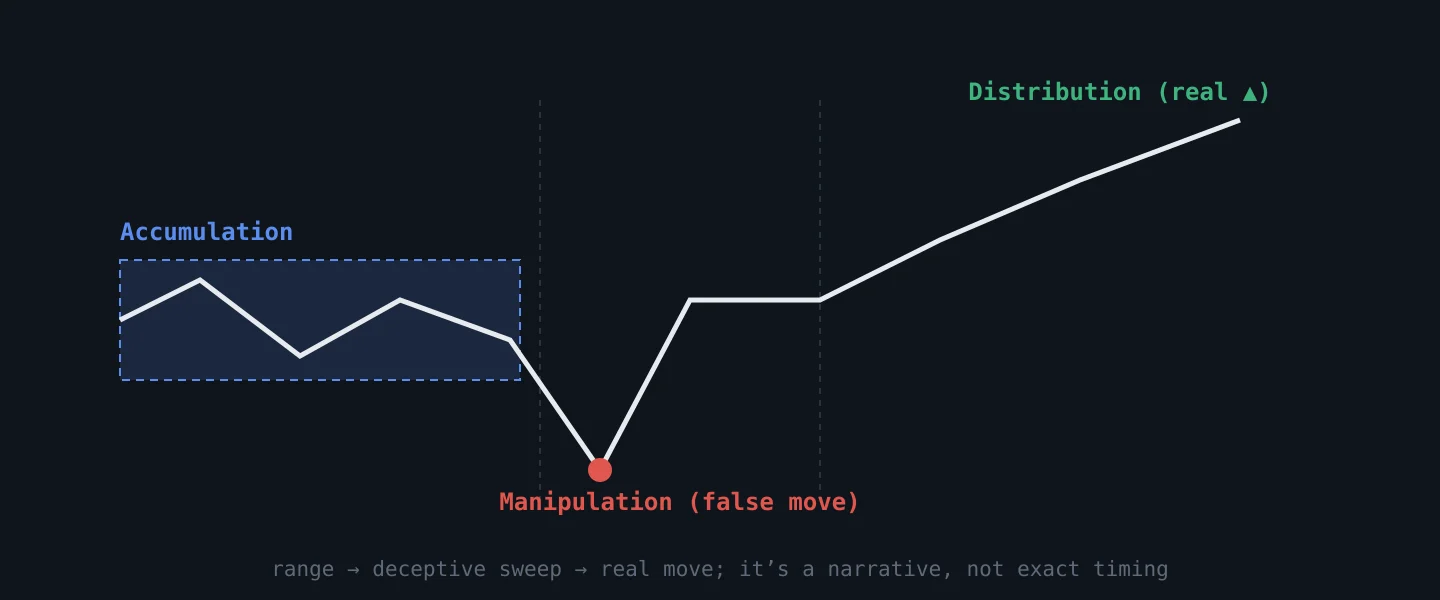
The Market Maker Model, sometimes called the AMD cycle or the "Power of 3", is a conceptual narrative explaining how large institutional players often move price through three distinct phases: Accumulation, a consolidation phase; followed by Manipulation, a false directional push to grab liquidity; and finally, Distribution, the actual intended market move.
What are the three phases of the Market Maker Model?
The model splits a move into three phases, and each has a recognisable shape on the chart.
- Accumulation — a tight trading range. Volatility contracts, the candles shrink, and neither side wins. The story attached is that large participants are building a position quietly; what you can actually verify is that the range is coiling and that obvious highs and lows are forming on both sides of it.
- Manipulation — a sharp, brief push outside the range that quickly reverses. This is the stop-hunt: it takes the orders resting just beyond the range boundary and then fails to follow through.
- Distribution — the sustained directional move away from the manipulated area, in the opposite direction to the false push.
The sequence is the whole idea: the fake move goes one way, the real move goes the other. A trader watching only the breakout sees a valid signal and takes it; a trader watching the model sees the breakout fail and takes the reverse.
Why does this "Power of 3" pattern matter to traders?
This pattern helps traders understand the likely intentions of "smart money" in the market, as described in SMC methodologies. It suggests that major players often engineer false moves to trap retail traders or activate orders, ensuring sufficient liquidity before initiating their primary directional push. Recognising this can help traders avoid being caught on the wrong side of such engineered moves.
Stripped of the intent, the useful claim is smaller and sturdier: a range accumulates orders on both sides, and the side that gets taken first is often not the side price ultimately goes. That is worth knowing whether or not anyone engineered it.
How do you read the AMD cycle on a chart?
Walked through with numbers on EUR/USD.
Price spends the Asian session in a tight range between 1.0860 and 1.0885 — that is the accumulation. Stops sit above 1.0885 from every short in the range, and below 1.0860 from every long.
At the London open, price spikes to 1.0894, takes the buy-stops above the range, and closes back inside within two candles. That failure is the manipulation: the level broke, nobody followed, and the orders above the range are gone.
The bias is now down. The distribution is the move that follows — price leaves the range through the opposite side and runs. An entry belongs on the return into the range after the sweep, around 1.0880, with the stop above the manipulation high at 1.0898, because a close above that says the read was wrong. Roughly 18 pips of risk against a move that started with the whole range as its runway.
The order of operations matters: you do not predict the manipulation, you wait for it to fail. Until price closes back inside, a break is just a break.
Is AMD the same thing as Wyckoff?
Very nearly, and the resemblance is worth knowing because the older framework is better documented.
Richard Wyckoff described market cycles almost a century ago in terms of accumulation, markup, distribution and markdown, and his schematics include a spring — a false break below support during accumulation, designed (in his telling) to shake out weak holders before the real advance. That is precisely what AMD calls manipulation.
There is one genuine trap in the translation. Wyckoff's distribution means the top of the cycle, where large holders sell into strength. AMD's distribution means the real directional move itself, in either direction. Same word, different phase — so a trader reading both literatures at once needs to keep track of which vocabulary is on the page.
Is the model real, or is it a narrative?
Both parts of that question have honest answers.
What is observable: ranges form, obvious levels get swept, and reversals after a failed breakout are common. Any trader can verify this on any chart, and it is the entire practical content of the model.
What is not observable: that a market maker deliberately staged the sequence to trap you. Forex has no central order book, no volume you can trust, and no way to attribute a move to a participant. The word "manipulation" imports an intent that the chart cannot show.
The failure mode is confirmation bias, and it is severe here because the model has three phases and therefore fits almost anything in hindsight. Every range becomes accumulation; every wick becomes manipulation. The discipline that fixes it is marking the range and the level before the move, and counting the times the break simply continued — because it often does.
What is a common beginner mistake with the AMD model?
Treating it as a timing tool. It is a conceptual narrative to explain price behaviour, not a schedule. There is no rule for how long accumulation lasts or when manipulation arrives.
Trading it in isolation. Confirm it with other concepts — BOS, CHoCH, FVG or an order block — and always check higher-timeframe structure. This context can also be weighed with tools like ForexCommand's MRS or CTS.
Calling every breakout a manipulation. Sometimes a range breaks because the market genuinely wants to go that way. If you label every failed entry as a trap, you never learn anything from it.
Fitting the phases after the fact. If you can only identify the accumulation once the distribution has happened, you have described the past, not traded the present.
The takeaway
AMD is a story about a sequence that does show up on charts: a range, a failed break one way, a real move the other. Use the sequence and ignore the theory of intent — mark the range in advance, wait for the break to fail rather than predicting it, and place invalidation beyond the sweep. It is a lens for reading a range, not a schedule the market has agreed to follow.