
Archive: October 2026· page 2
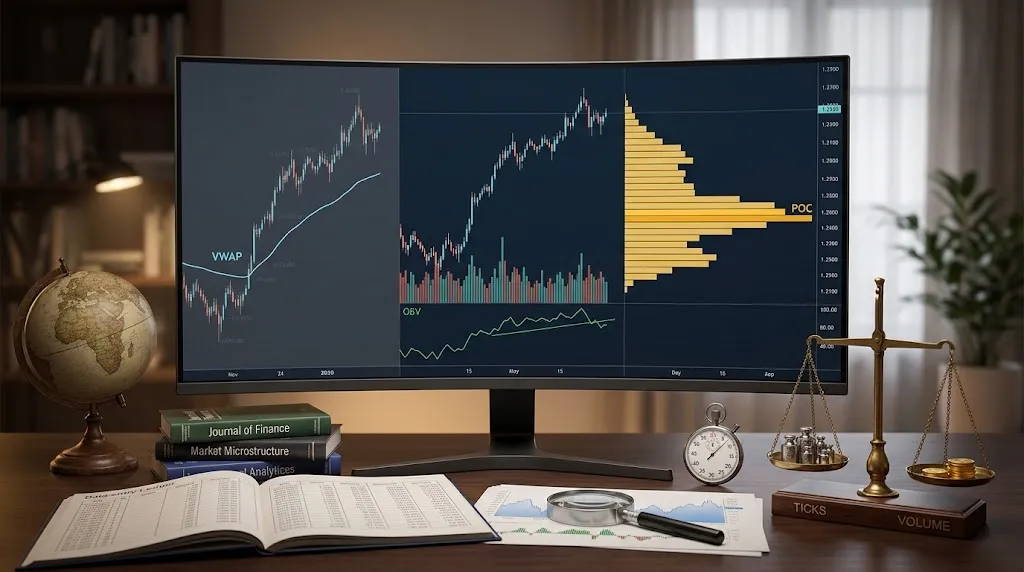
VWAP vs OBV vs volume profile: what each one measures on a forex chart
VWAP, OBV and volume profile on ticks: on 84 days of EUR/USD, ticks barely moved VWAP, the POC sometimes jumped, and OBV went against price one day in five.

How much does forex trade a day? The BIS figure and what it does not mean
$9.5 trillion a day in April 2025, by the BIS's final count. Under a third of it is spot, the biggest slice is funding and hedging, and the month itself was unusual.
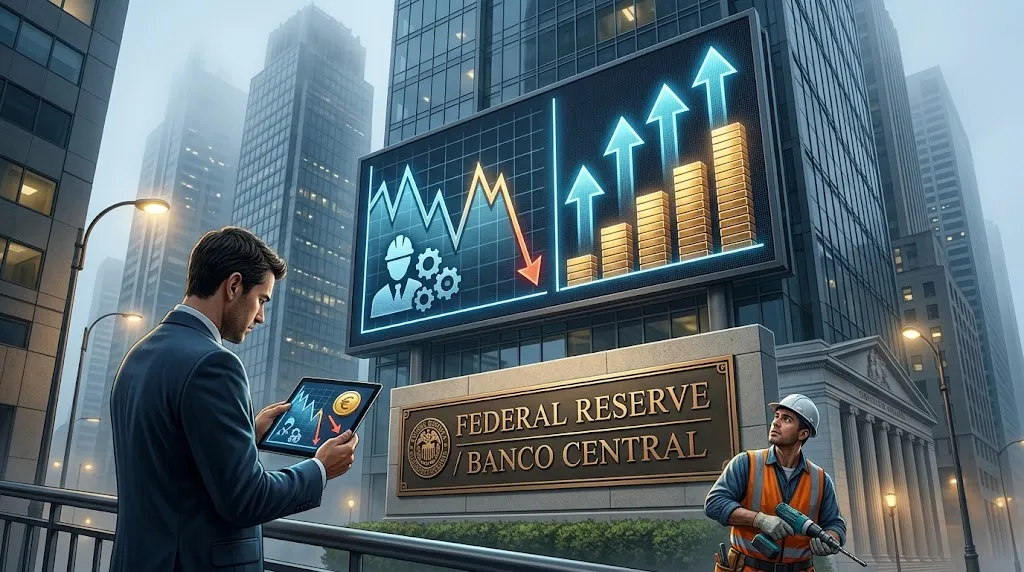
Payrolls took October off the Fed's table, and yields rose anyway
September payrolls rose just 29,000 and took an October Fed hike off the table. So why did US yields close Friday higher, and the euro lose 1.22% on the week?

Payrolls rise just 29,000, knocking out October Fed hike bets
US payrolls rose by 29,000 against a 90,000 consensus and, according to FXStreet, knocked out October Fed hike bets; the euro led our strength table.

Silver (XAG/USD): how much does it move, when, and what moves it?
A $2.73 median day, almost twice gold as a percentage, and a "normal" that is still falling. Measured on 130 days of our own price history.

Gold (XAU/USD): how much does it move, when, and what moves it?
A $91 median day, 56% of the range in the London–New York overlap and a second peak in Asia. Measured on 130 days of our own price history.

Euro breaks below 1.13 and the dollar index hits a yearly high
The dollar index set a new yearly high and EUR/USD fell below 1.13 for the first time since May 2025; the yen weakened yet led our strength table again.

Core PCE undershoots at 0.2%, yet yields and the dollar end higher
Softer US core PCE trimmed bets on an October Fed hike and briefly lifted the euro, but yields and the dollar ended Wednesday higher; the Australian dollar lost 0.57%.
