How much does forex trade a day? The BIS figure and what it does not mean
$9.5 trillion a day in April 2025, by the BIS's final count. Under a third of it is spot, the biggest slice is funding and hedging, and the month itself was unusual.
The currency market turned over $9.5 trillion a day in April 2025, according to the final figures of the Triennial Survey of the Bank for International Settlements (BIS). Less than a third of that is spot trading, the closest thing to what a retail trader does. The biggest slice is short-term funding and hedging, and the month itself was unusual.
The figure appears in almost every introduction to forex, including some of ours. This article is about where it comes from, what it is made of, and the three things people most often read into it that it does not say.
Where does the $9.5 trillion come from?
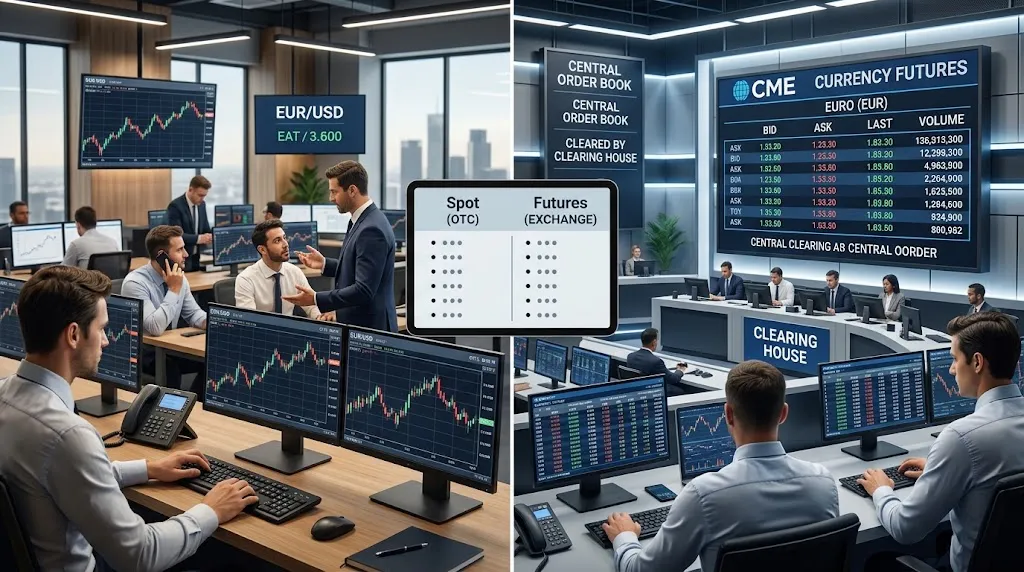
Every three years the BIS (Bank for International Settlements, the central banks' bank) asks central banks to collect the currency trading of the dealers in their jurisdictions during one month, April. The result is the Triennial Survey, the reference census of the market. Spot forex has no central exchange, as we explain in our comparison of over-the-counter (OTC) and exchange trading, so there is no tape to add up any other way.
Two numbers circulate, and both are real. The preliminary results of September 2025 said $9.6 trillion a day, up 28% from $7.5 trillion in 2022.
The final figures, published in December 2025, are $9.51 trillion, up 27% from $7.47 trillion. The total is a daily average, and it is counted net of double-counting between dealers.
What is actually traded?
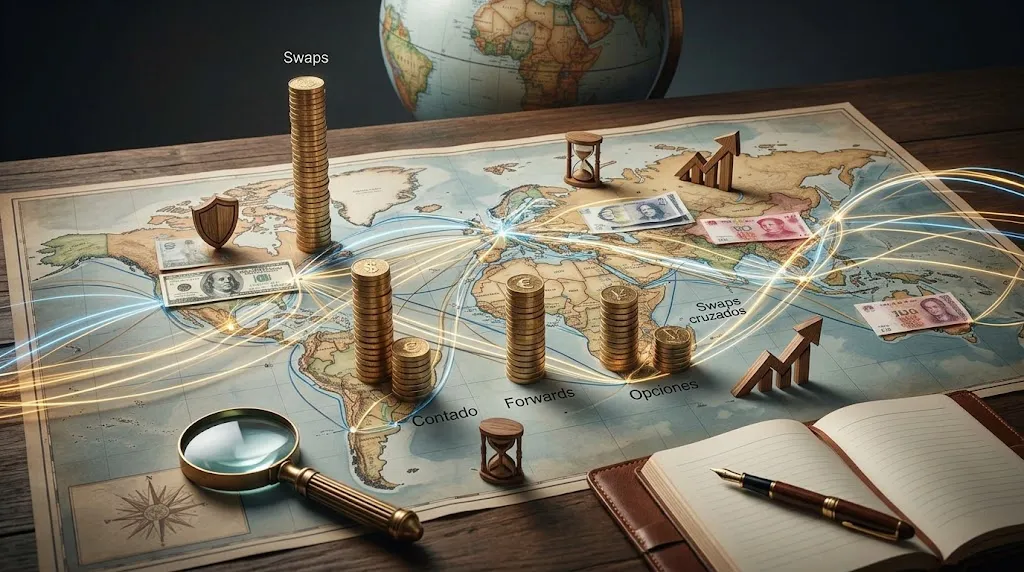
The total adds up five instruments, and they are not the same business.
| Instrument | $ billion a day | Share |
|---|---|---|
| FX swaps | 4,015 | 42% |
| Spot | 2,952 | 31% |
| Outright forwards | 1,747 | 18% |
| Options | 632 | 7% |
| Currency swaps | 164 | 2% |
Final figures, April 2025, BIS Quarterly Review, December 2025.
FX swaps, short for foreign exchange swaps, are the largest line. One swap combines a spot deal with a forward in the opposite direction, mostly for seven days or less, and it is used mainly to manage funding in another currency and to hedge currency risk. It is not the overnight swap your broker charges or pays, which is an interest adjustment on an open position; that one is covered in our breakdown of spread, commission and swap.
Spot, the instrument closest to a retail trade, was $2.95 trillion a day. That is the figure to compare anything retail against, not the $9.5 trillion.
Why was April 2025 so big?
The survey month happened to be the month of the US tariff announcements. The BIS estimates a spike of about $1.1 trillion a day in spot trading during April, and writes that, extrapolating the prior trend, spot turnover without the tariff effects would have been flat or even lower than in April 2022. It attributes roughly $400 billion of the $1.75 trillion in forwards to trading around the same news.
In all, the BIS estimates that the tariff announcements added about $1.5 trillion to overall turnover, so the 27% growth is partly one month's shock. The survey takes a photograph, and this one was taken during a storm.
How has it grown since 1989?
| Survey | Total, $ billion a day | Spot, $ billion a day |
|---|---|---|
| 1989 | 539 | 305 |
| 1998 | 1,527 | 568 |
| 2001 | 1,239 | 386 |
| 2007 | 3,324 | 1,005 |
| 2013 | 5,357 | 2,047 |
| 2016 | 5,066 | 1,652 |
| 2022 | 7,468 | 2,085 |
| 2025 | 9,510 | 2,952 |
Selected surveys, net-net basis, daily averages in April. BIS Quarterly Review, December 2025, annex table A.1.
The line does not only go up. Turnover fell in 2001 and again in 2016, and spot in 2016 was below its 2013 level.
Who trades it, and where?
Dealers trading with each other were 47% of the total in the final figures, and other financial institutions 49%, among them banks that do not report to the survey, institutional investors, hedge funds and proprietary trading firms. Non-financial customers, such as companies, were 5%.
Retail traders do not get their own line. The brokers that aggregate them can fall into a residual category, "other non-bank financials", which can also include securities firms and the financial arms of corporates. That whole category was $273 billion a day, 3% of the market.
By currency, the US dollar was on one side of 89.2% of all trades in the preliminary results, the euro of 28.9% and the yen of 16.8%. These shares add up to 200%, not 100%, because every trade has two currencies; why the dollar sits in almost all of them is its own story. In the final figures, the most traded pair was USD/EUR (EUR/USD on a trading screen), followed by USD/JPY, with USD/CNY third.
By location, again in the preliminary results, sales desks in the United Kingdom handled about 38% of trading and those in the United States about 19%, with Singapore and Hong Kong behind them. Those four centres intermediated three quarters of all trading, counted on a slightly different basis from the global total.
What does the figure not tell you?
It is not the volume on your chart. The bar under an MT5 (MetaTrader 5) chart counts price changes on your broker's feed, not money, as we show in our article on what the MT5 volume bar counts.
It is not the liquidity at your hour. A daily average is spread unevenly across the day, and in EUR/USD the London–New York overlap holds 61% of the day's range, as measured in our anatomy of EUR/USD. An average for the day says nothing about the hour you trade.
It is not the market your broker shows you. Your price comes from your broker's liquidity, not from a central book that holds $9.5 trillion. For scale on the exchange side, by our own estimate, explained in our comparison of OTC and exchange trading, CME (Chicago Mercantile Exchange) currency futures trade around 3% of the spot figure.
What the figure does give you is a sense of proportion: the market is enormous, and more than two thirds of it is not spot trading at all.