VWAP vs OBV vs volume profile: what each one measures on a forex chart
VWAP, OBV and volume profile on ticks: on 84 days of EUR/USD, ticks barely moved VWAP, the POC sometimes jumped, and OBV went against price one day in five.
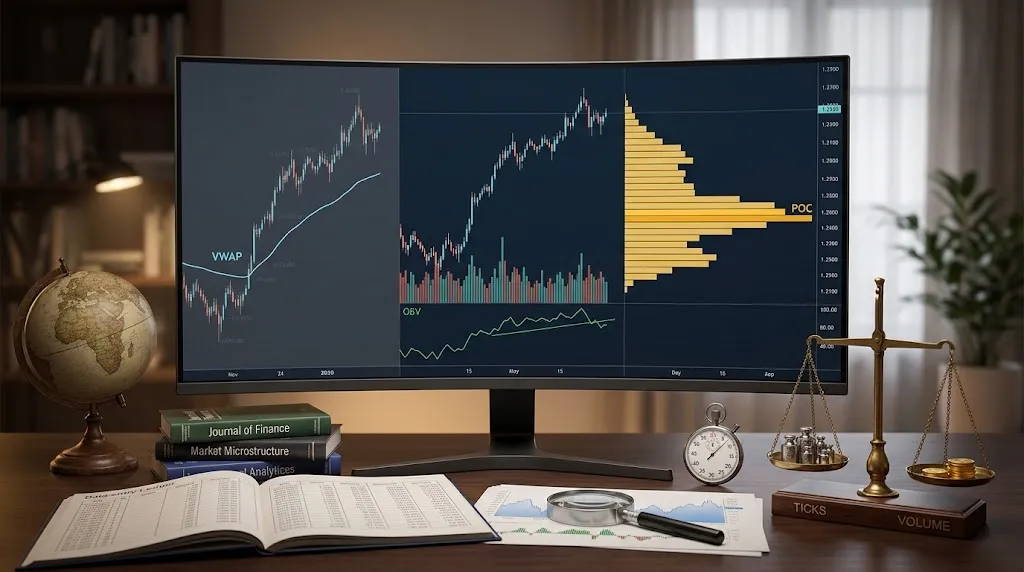
Volume-weighted average price (VWAP), On-Balance Volume (OBV) and volume profile are all built on volume, and on a spot forex chart that volume is ticks: the volume bar in MetaTrader 5 (MT5) counts price changes, not money. The three tools stack those ticks in different ways, so they answer different questions. We measured how much the tick weighting changes each one on 84 days of our own EUR/USD data, and the answer is very different for each tool.
Three tools, three questions
| Tool | What it computes | The question it answers | What you see |
|---|---|---|---|
| VWAP | The session's average price, each price weighted by its volume | Where has the session traded on average? | A line on the price |
| OBV | A running total that adds a bar's volume on an up close and subtracts it on a down close | Is volume heavier on rising bars or on falling ones? | A line under the chart |
| Volume profile | The volume at each price level | At which prices did the activity sit? | A sideways histogram |
The first two run through time, bar after bar. The profile throws time away and sorts the same volume by price.
VWAP: the session's average price
VWAP adds up each price times its volume and divides by the total volume. Prices where a lot traded pull the average towards them; prices that barely traded hardly count. It is usually reset at the start of each session, so it is a one-day line.
It comes from execution, not from chart reading. In 1988, Berkowitz, Logue and Noser measured the cost of some 14,000 institutional trades on the New York Stock Exchange against the day's VWAP, in a paper in the Journal of Finance. On a chart it reads as the session's average: price above it means the session is trading above where it has traded on average.
Forex has no opening bell, so the tool has to choose when the session starts. Each platform or add-on has its own default hour, often one you can change, and the line changes with it.
OBV: volume's running score
OBV is attributed to Joseph Granville. MT5's own help gives the rule: if a bar closes above the previous close, add its volume; if it closes below, subtract it; if it closes level, leave the total as it is.
The number itself means nothing; what traders read is its direction. OBV rising with price says volume is heavier on the up bars. OBV falling while price rises, or rising while price falls, is called a divergence.
Volume profile: where the activity sat
A volume profile turns the chart on its side: it adds up the volume at each price and draws it as a horizontal histogram. The widest row is the point of control (POC), and the band holding about 70% of the volume is the value area. We read it in detail in our guide to where the market accepts or rejects price.
A market profile asks the same question with time instead of volume: how long price spent at each level. That difference is the one we measured.
What the tick weighting changes
We took the one-minute bars of EUR/USD, GBP/USD and USD/JPY on every Monday-to-Thursday day between 4 May and 1 October 2026, from 00:00 to 24:00 UTC. We kept the days with at least 1,400 of their 1,440 minutes in our feed, 84 of 88 for EUR/USD and 85 for the other two, and left out Fridays, when the market closes at 21:00 UTC.
For each day we computed each tool twice: once weighted by ticks, as a chart does, and once giving every minute the same weight, which is what the tool would show with no volume at all. VWAP uses each bar's typical price, the average of its high, low and close; the profile spreads each bar over its range. OBV uses one-hour bars, with one-minute bars as a check, and the day's direction compares the day's last close with the open at 00:00.
| Pair | Days | Median daily range | VWAP vs the time average, median | POC on the same pip | POC more than 10 pips apart | OBV against the day's direction |
|---|---|---|---|---|---|---|
| EUR/USD | 84 | 47.7 pips | 1.4 pips | 37 days | 19 days | 16 days |
| GBP/USD | 85 | 65.9 pips | 1.6 pips | 37 days | 24 days | 14 days |
| USD/JPY | 85 | 70.9 pips | 2.3 pips | 29 days | 25 days | 26 days |
Ticks barely move VWAP. On EUR/USD the tick-weighted VWAP ended the day a median 1.4 pips from the plain time average, about 3% of the day's range, while the day's close sat a median 10.1 pips from VWAP. On a spot chart, VWAP is close to the average price by time, and the ticks add little to it.
Ticks leave the POC almost in place on just over half the days, and sometimes make it jump. The two POCs landed within 2 pips of each other on 45 of the 84 EUR/USD days, and more than 10 pips apart on 19. Usually that is not a near tie: in the profile built by time, the level the ticks chose held a median 68% of the peak, and only 3 of the 19 days reached 90%.
The value areas mostly agree: they share a median 83% of their combined width.
OBV and price part ways often. On one-hour bars, OBV ended the day against the direction of EUR/USD on 16 of 84 days, about one day in five. A plain count of rising and falling hours, with no volume at all, matched the day's direction on 64 days against OBV's 68; on GBP/USD it was 64 against 71, and on USD/JPY the two tied at 59.
Which one to use for what
- For the session's average price, VWAP. On spot forex it stays close to the plain average price by time, so read it as that.
- For the prices where activity sat, the volume profile, read the way our guide to acceptance and rejection explains. On just over half the days, 54% to 58% depending on the pair, the ticks leave its POC within 2 pips of the one built by time, but on 19 to 25 of about 85 days per pair they moved it more than 10 pips.
- For whether volume leans with price, OBV, knowing that on one-hour EUR/USD bars it ended the day against price about one day in five in our sample, and on one-minute bars on 29 of 84 days.
In MT5, OBV comes with the platform: its help lists four volume indicators, Accumulation/Distribution, Money Flow Index, On Balance Volume and Volumes. VWAP and volume profile are not on that list. They come as add-ons, each with its own defaults for the session start and the price rows, so two of them can draw different lines on the same chart.
What this article does not tell you
- It does not say whether any of the three makes money or predicts the next move. We measured what they show, not what follows them, and a divergence that shows up one day in five needs its own test before it means anything.
- Our ticks come from one broker's feed. Another broker may count different ticks, because each feed counts its own price updates, as our look at the MT5 volume bar explains.
- We measured VWAP at the end of each day, not its path during the day.
- The session start of 00:00 UTC is our choice, and our profile is built from one-minute bars by spreading each bar's ticks evenly over its range. A platform with tick-by-tick data builds a finer one.