Gold (XAU/USD): how much does it move, when, and what moves it?
A $91 median day, 56% of the range in the London–New York overlap and a second peak in Asia. Measured on 130 days of our own price history.

Nearly everything written about gold says the same two things: it is a safe haven and it protects against inflation. Depending on the year that may or may not hold, and either way it answers nothing you need to know before opening a position.
This article answers three other questions. How much range does a normal day have? At what hours does it happen? And what causes it? All three answers are measured on our own price history, as in the EUR/USD article, and you can follow them live on the gold dashboard.
How the numbers were built. One-hour XAU/USD bars from January 2021 to October 2026, with hours in UTC. The headline figures use the last 130 Monday-to-Friday days with data (27 March to 1 October 2026), not the two years we use for currency pairs; the reason is further down. And they are in dollars, not pips, because not every broker defines a gold pip the same way.
How much does gold move in a day?
The median daily range — the distance between the day's high and low — is $91. On the median, that is 2.08% of each day's price.
But the median alone misleads: one day in ten covers almost three times as much as another day in ten.
| Kind of day | Range |
|---|---|
| Very quiet (10th percentile) | $57 |
| Quiet (25th percentile) | $73 |
| Typical (median) | $91 |
| Busy (75th percentile) | $122 |
| Very busy (90th percentile) | $155 |
Only 6% of days stayed under $50, and 14% went past $150. To put a size on it: with the 100-ounce lot our calculators use, a typical day is about $9,100 of range per standard lot. Your broker may use a different contract size, so check it with the position size calculator before you trade.
And if you live in the US, leveraged spot gold and silver are not available at a forex broker: since 16 July 2011, the Dodd-Frank Act has barred offering them to retail clients off a regulated exchange. Leveraged exposure there goes through futures on a regulated exchange, with different specifications and risks.
Why six months and not two years?
Because the gold of two years ago was a different market. This is the median daily range depending on the window:
| Window | Median daily range |
|---|---|
| Last 521 days (two years) | $62 |
| Last 260 days (one year) | $90 |
| Last 130 days (six months) | $91 |
| Last 65 days (three months) | $88 |
On two years, almost half of the days in these six months (45%) would read "busy", above that window's 75th percentile. On one year, six months or three months the figure barely moves, which is why we use six.
The easy explanation would be that gold is worth more, so it covers more dollars. That is only half of it:
| Quarter | Median range | As % of price | Median close |
|---|---|---|---|
| Q4 2024 | $30 | 1.12% | $2,650 |
| Q1 2025 | $35 | 1.21% | $2,890 |
| Q2 2025 | $64 | 1.93% | $3,318 |
| Q3 2025 | $44 | 1.31% | $3,375 |
| Q4 2025 | $76 | 1.85% | $4,152 |
| Q1 2026 | $124 | 2.46% | $4,963 |
| Q2 2026 | $100 | 2.16% | $4,561 |
| Q3 2026 | $88 | 2.04% | $4,288 |
In daily UTC closes from our feed, price went from a low of $2,561.78 (15 November 2024) to a high of $5,520.37 (28 January 2026), and on 1 October 2026 it closed at $4,181.76. But the range as a percentage doubled too: from 1.12% to 2.46% at the peak, and it is still around 2%. Gold is not just more expensive; it moves more.
At what hours does it move?
This is the median range of each hour over the last 130 days:
| Window (UTC) | Median range per hour |
|---|---|
| 00:00–02:00 · Asian morning | $17 to $24 |
| 03:00–04:00 · Asian midday | $11 to $14 |
| 05:00–11:00 · Asian afternoon and European morning | $14 to $19 |
| 12:00–15:00 · London–New York overlap | $21 to $27 |
| 16:00–19:00 · New York afternoon | $14 to $16 |
| 20:00–21:00 · daily pause (no bars on 129 of 130 days) | — |
| 22:00–23:00 · reopen | $12 to $18 |
The peak is at 13:00 UTC, with $27.3, and the trough at 04:00, with about $11. There is a second peak at 01:00 UTC, with $24.4 — 9:00 in Shanghai and 10:00 in Tokyo.
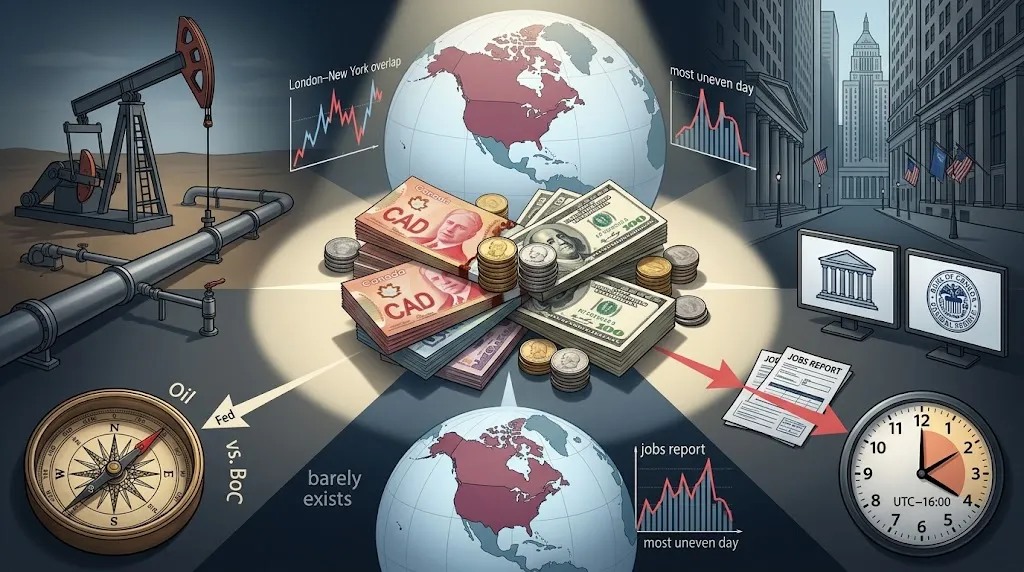
The London–New York overlap still rules: on a typical day those four hours hold 56% of the range, against 59% for EUR/USD over the same 130-day window. The difference is Asia. On the European pairs the Asian session moves roughly half as much as the overlap; on gold it moves about 71% as much. If you trade Asian hours, gold, like USD/JPY, does not fall asleep. (The 56% is the median, day by day, of those four hours' range over the whole day's; the 71% compares the average of the hourly medians from 00:00 to 07:00 UTC with that from 12:00 to 16:00.) Which sessions are open right now is on the session clock.
What moves gold?
The dollar. Gold is priced in dollars: when the dollar weakens it takes more dollars to buy an ounce, and the price rises. Over the last 130 days, daily returns of gold and EUR/USD had a correlation of 0.64. There is nothing more between them: in our study of gold and EUR/USD, the correlation of almost six years (+0.393) fell to −0.014 once the dollar was taken out. Both run on the same engine.
Real interest rates. Gold pays no interest, so it competes with bonds that do, once inflation is taken off. When the Federal Reserve (Fed) tightens, that opportunity cost rises; the mechanism is in our article on the Fed and real yields.
US data. We measured it with the same method as the pairs: in the hour non-farm payrolls (NFP) are released, gold's range is 1.56 times that same hour on a normal day, over 64 first Fridays of the month, the usual release day. EUR/USD reaches 2.38. Do not read that as the data moving gold less: in that hour gold covers 0.71% of its price, against 0.42% for EUR/USD. What is smaller is the jump over its normal hour, which on gold is already one of the busiest of the day. To size a position with a release ahead, there is the news risk calculator.
What about the safe haven?
It does not always work. In July 2026, with new US strikes on Iran and the Revolutionary Guard declaring the Strait of Hormuz closed, gold fell. The market read it as an inflationary shock, not a deflationary one, and that turned the safe-haven playbook around; we covered it in our analysis of that week. "Gold rises when there is fear" is a tendency, not a rule.
And silver?
Silver is the more nervous relative: its daily returns had a correlation of 0.89 with gold's over the last 130 days, but as a percentage it moves almost twice as much, 3.98% of its price on a typical day against gold's 2.08%. We measured it in our article on how much silver moves, and it has its own live dashboard.
Is it a good instrument to start with?
Carefully, because of size rather than direction. A typical $91 day can be a lot of money per lot, and one day in ten goes past $155. Before thinking about direction, think about how much room a position takes.
It has two honest advantages: it moves during more hours than the European pairs, and its engines have names (the dollar, real rates and US data). And one trap: a gold pip changes from broker to broker, so a "200-pip" stop does not mean the same on every platform. Think in dollars, measure the spread against the range you expect, and use ATR (Average True Range) to fit the stop to the volatility of recent weeks.
What these numbers do not tell you
There are five limits, and none of them is minor.
- The median is not your day. It describes the middle of the distribution, not what will happen tomorrow.
- Six months is a short window. It adapts faster to a change of regime, but it can also lag if gold speeds up or calms down again; the dashboard recomputes it every day.
- There is no spread or slippage inside. Our history stores prices, not costs, so everything above is gross range.
- The granularity is one hour and the feed has gaps. Five days are missing from the months measured and four more arrived incomplete; on complete days only, the median would be $92. Another broker would give similar figures, not identical ones.
- This is not a forecast. It describes how gold has behaved, and past behaviour shapes the expectation, not the outcome.