EUR/USD: how much does it move, when, and what moves it?
A 64-pip median day, 61% of the range inside four hours, and a 0.80 correlation with GBP/USD. Measured on 521 days of our own price history.
Almost everything written about EUR/USD says the same thing: it is the most liquid and most traded pair. That is true and it is useless, because it answers none of the questions you actually ask before opening a position.
This article answers three others. How far does a normal day travel? What hours does it travel in? And what causes it? All three answers are measured against our own price history rather than quoted from somewhere else.
How the numbers were built. Hourly EUR/USD bars from January 2021 to September 2026. The headline figures use the last two years — 521 Monday-to-Friday days — and exclude Sundays, which in UTC hold only the first two or three hours of the week and would drag the median down. Every hour below is UTC.
How much does EUR/USD move in a day?
The median daily range is 64 pips: the distance from the day's high to its low. If that unit is new to you, start with our guide to pips and their value.
The median on its own is misleading, though, because the spread of outcomes is wide:
| Kind of day | Range |
|---|---|
| Very quiet (10th percentile) | 37 pips |
| Quiet (25th percentile) | 48 pips |
| Typical (median) | 64 pips |
| Busy (75th percentile) | 89 pips |
| Very busy (90th percentile) | 116 pips |
One day in ten travels three times as far as another day in ten. Any plan built on "EUR/USD does about 60 pips" will be wrong 20% of the time, and it will be wrong in both directions.
Set beside the other big dollar pairs, EUR/USD is one of the calm ones:
| Pair | Median daily range | Days under 40 pips |
|---|---|---|
| USD/CHF | 53 pips | 24% |
| USD/CAD | 59 pips | 17% |
| EUR/USD | 64 pips | 15% |
| GBP/USD | 80 pips | 5% |
| USD/JPY | 112 pips | 4% |
⚠️ That table compares pips, not money. A USD/JPY pip is not worth what a EUR/USD pip is worth, so the yen's 112 pips are not double the risk of the euro's 64. To turn range into currency, use the position size calculator.
What hours is it genuinely alive?
This is where the pair stops being an average and becomes a timetable. Here is the median range of each hour:
| Window (UTC) | Median range per hour |
|---|---|
| 22:00–05:00 · Asia | 6 to 10 pips |
| 06:00–08:00 · London opens | 12 to 16 pips |
| 09:00–11:00 · European morning | 12 to 13 pips |
| 12:00–16:00 · London–New York overlap | 14 to 19 pips |
| 17:00–21:00 · New York afternoon | 8 to 12 pips |
The peak sits at 14:00 UTC with 19.3 pips, and the trough between 22:00 and 23:00 with 6.4. That is a threefold difference inside the same pair on the same day.
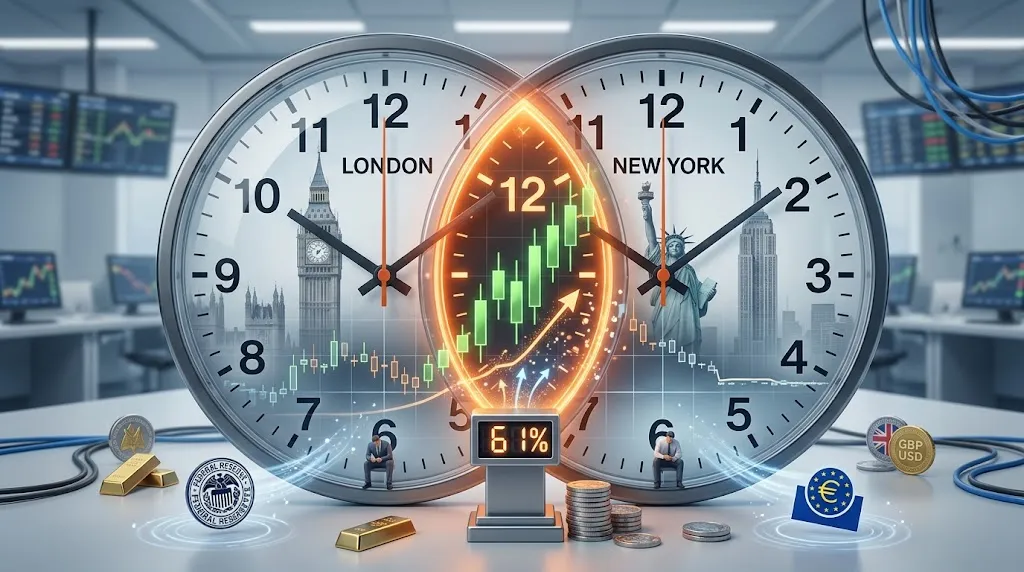
And the figure that organises everything else: the London–New York overlap holds 61% of the day's range. Four hours out of twenty-four take almost two thirds of the movement — it is what makes the session overlap the stretch that matters most.
Two practical consequences follow, and neither is an opinion. If you trade Asian hours, EUR/USD is not your pair — you are asking it for movement precisely when it has none. And if your strategy needs price to cover distance, you have four hours a day, not a full session. The rest of the map is in forex trading sessions and when the market is awake and in the hours and places liquidity concentrates, and you can watch it live on the session clock.
What moves EUR/USD?
The dollar, nearly always. The Bank for International Settlements (BIS) measures this market every three years, and in its April 2025 survey the dollar was on one side of 89.2% of all foreign exchange trades, up from 88.4% in 2022 (BIS triennial survey). EUR/USD is less a story about the euro than a story about the dollar told with the euro on the other side.
That resolves into three sources of movement, strongest first:
- US data. We measured it: in the hour non-farm payrolls (NFP) are released, EUR/USD's range is 2.38 times its range for that same hour on an ordinary day. The control that validates the measurement is EUR/GBP — which carries no dollar — and it only reaches 1.30.
- Central-bank divergence. What matters is not what the Federal Reserve (the Fed) does, nor what the European Central Bank (ECB) does, but the distance between the two.
- Inflation on both sides, because it is the reading both of those decisions hang on. If the mechanism is not clear, it is in our explainer on inflation.
The jump in those minutes is not ordinary movement at higher speed — it is a different thing, explained in our piece on price jumps around news. To size a position knowing a release is coming, there is the news risk calculator.
What does not move it, despite appearances?
Three relationships that get repeated everywhere and hold up badly once measured.
Gold does not lead EUR/USD. The correlation between them is +0.393 across nearly six years, which looks like a lot. Strip the dollar out of the equation and −0.014 is what remains, which is nothing: both were moving for the same reason, not one behind the other. The detail is in our study of gold and EUR/USD.
GBP/USD is not a second trade. We measured the correlation of both pairs' daily returns over the same two-year window: 0.80. Buying EUR/USD and buying GBP/USD together is not diversification, it is the same dollar bet at double the size — the reasoning is in currency correlation.
USD/CHF is that same trade inverted. Its correlation with EUR/USD is −0.83, the strongest of the six pairs we measured: buying one and selling the other is not two ideas, it is one idea twice. And buying both at once opens two positions that cancel each other while you pay the cost of both.
Is it a good pair to start on?
Yes, and for a different reason than the one usually given. It is not that it "moves little" — it is that it moves legibly. The range is concentrated in an identifiable window, the cause usually has a name and a slot in the calendar, and 89.2% of the market is pushing in the same direction it is.
There are two honest costs. The first is patience: 15% of days never reach 40 pips, and no distance-based strategy works there. The second is cost itself, which weighs proportionally more on a calm pair — always measure the spread against the range you expect, never in the abstract.
And to turn all of this into a stop, the right tool is not the median but ATR (Average True Range), which measures the same thing while adapting to the volatility of these weeks rather than of two years.
What these numbers do not tell you
Five limits, none of them minor.
- The median is not your day. It describes the centre of a distribution, not what happens tomorrow.
- No spread and no slippage are inside it. Our history stores prices, not costs, so everything above is gross range.
- The granularity is one hour. A five-minute spike inside an hourly candle is invisible, so these figures understate the first move on a release.
- It is a single feed — our broker's, normalised to UTC. Another broker would give similar numbers, not identical ones.
- This is not a forecast. It describes how the pair has behaved, and past behaviour shapes the expectation, never the outcome.