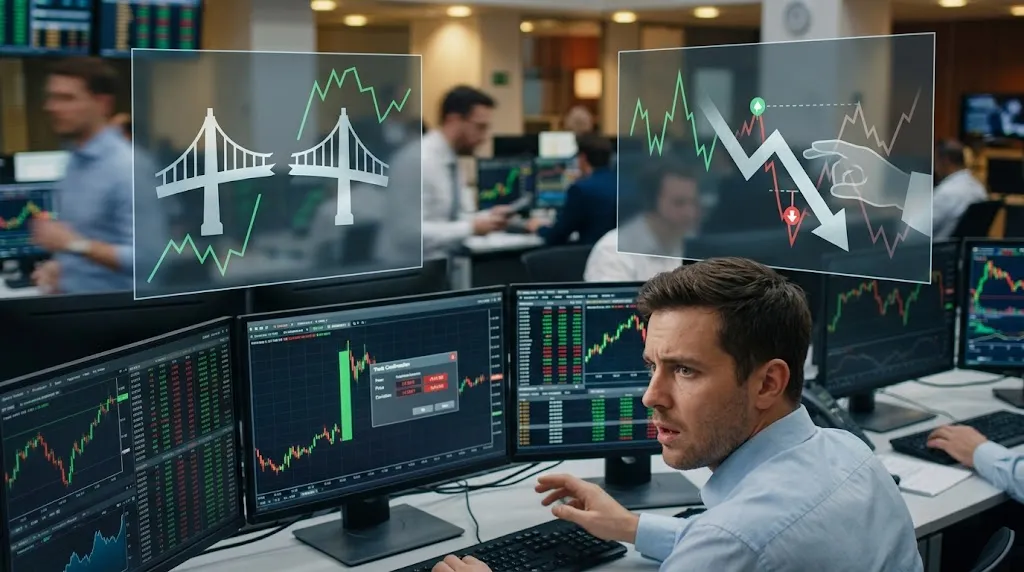
Volatility vs liquidity vs volume: a busy market is not a deep market
Volatility is how far price moves, liquidity how much you can trade without moving it, volume how much was traded. We measured the two moments they split.

Volatility is how far price moves, liquidity how much you can trade without moving it, and volume how much was traded. Most of the day the three rise and fall together, which is why they get used as synonyms. We measured the two moments when they split, and those are the ones that cost you money.
Three words, three different questions
Each of the three answers a different question, and in forex each one is measured differently, or not at all.
| The question it answers | How it is measured | What a retail trader can see | |
|---|---|---|---|
| Volatility | How far does price move? | Range per bar, Average True Range (ATR) | All of it, on any chart |
| Liquidity | How much can I trade without moving the price? | Depth of the order book | Not directly: forex has no central book |
| Volume | How much was traded? | Contracts or lots exchanged | Only tick volume, a count of price updates |
The liquidity row is the awkward one. As we explain in our article on the order book and depth of market, spot forex has no exchange, so nobody can show you the whole book. What you see instead is its side effects: the spread, slippage, and how smoothly price moves.
The volume row is awkward too. MetaTrader 5 (MT5) bars carry two volume fields: tick volume and real volume. Our feeder's broker leaves the second one empty: in the 3.4 million one-minute and one-hour bars we store for twelve symbols, real volume is 0 on every one. What the platform calls volume is the number of times the price changed.
The source of the confusion: most of the day they move together
We took every one-minute EUR/USD bar our MT5 feeder recorded between 21 April and 28 September 2026, Monday to Friday, and grouped them by hour (UTC). The first two columns are medians per minute. The third divides the total range by the total ticks, to show how far price travels each time it updates.
| Hour (UTC) | Range per minute | Ticks per minute | Pips per 100 ticks |
|---|---|---|---|
| 03:00 | 0.7 pips | 58 | 1.21 |
| 08:00 | 1.4 pips | 131 | 1.08 |
| 14:00 | 1.8 pips | 207 | 0.91 |
| 20:00 | 0.7 pips | 39 | 1.27 |
| 21:00 | 0.6 pips | 10 | 5.85 |
| 22:00 | 0.5 pips | 27 | 1.49 |
At 14:00 UTC, inside the London–New York overlap, EUR/USD ties with 13:00 for the widest range of the day, has the most ticks, and also moves in the smallest steps: 0.91 pips per 100 ticks, the lowest of the 24 hours.
The most volatile hour is also the busiest and the smoothest. Watch that hour long enough and the three concepts start to look like one.
They are not one, even minute by minute. Across those bars, the rank correlation between range and tick volume is 0.54 on EUR/USD, 0.50 on GBP/USD, 0.67 on USD/JPY and 0.54 on AUD/USD: clearly related, far from interchangeable.
Split 1: the rollover, little volume and little depth
Look at the 21:00 row. It is 5 PM in New York, the daily close when the swap is charged, and, as we explain in our article on liquidity, the moment liquidity providers change books and depth briefly evaporates across every pair. Ticks per minute collapse to 10, a twentieth of the overlap.
Yet the bars do not go quiet. From Monday to Thursday (on Fridays the market has already closed by 21:00), in the ten minutes after 21:00, the median EUR/USD minute spans 1.3 pips on 10 ticks, against 0.6 pips on 41 ticks in the ten minutes before. All four pairs we checked do the same: between 5 and 10 ticks in the median minute, and each tick covering between nine and sixteen times more ground than before 21:00.
That range is not traders pushing price around. On all four pairs the 21:00 minute closes lower on most days (on GBP/USD, 65 days down against 14 up, by a median of 4.5 pips), and the next five minutes tilt the other way. A drop that undoes itself looks like the quote opening up with the spread and closing again, not like a move; our bars do not carry the spread, so that reading is an inference.
So the rollover is thin liquidity in its purest form: little volume, and a range that measures the gap between quotes more than the market's energy. It is the same mechanism as in our article on the overnight spread: fewer quotes, a wider gap and more slippage.
Split 2: the news minute, the most volume and still thin
The opposite case is a big release. US Non-Farm Payrolls (NFP) print at 8:30 in New York, 12:30 UTC in summer. These are the EUR/USD bars around the last two releases in our data:
| Minute (UTC) | 7 August: range | Ticks | Pips per 100 ticks | 4 September: range | Ticks | Pips per 100 ticks |
|---|---|---|---|---|---|---|
| 12:29 | 2.8 pips | 339 | 0.83 | 2.4 pips | 212 | 1.13 |
| 12:30 | 41.1 pips | 1,284 | 3.20 | 39.6 pips | 1,582 | 2.50 |
| 12:31 | 5.0 pips | 766 | 0.65 | 5.2 pips | 1,047 | 0.50 |
In the release minute, volume and volatility both explode: the most ticks of the whole day and a range about fifteen times the minute before. Yet each tick moved price two to four times further than the minute before: the market was at its busiest minute of the day, and it was thin.
As we explain in our article on price jumps at news releases, liquidity providers pull their quotes before the number, and the first orders after it cross an almost empty book.
By 12:31 the steps were back to normal, the smallest in the table, with still more ticks than before the release. The big jump lasted a minute; the volume stayed.
The rollover and the release are opposites on volume and alike on liquidity. That is the whole point: the tick counter cannot tell you whether the market is deep.
What each one is for
- Volatility sets the size of the trade. It decides how far your stop-loss has to be to survive the noise, and so how large the position can be. That is the ATR method for position sizing.
- Liquidity sets the cost and the hour. It decides the spread you pay and how far from your price you get filled. You cannot see it, but you can avoid its two predictable holes: the minutes around the rollover and the seconds around a scheduled release.
- Tick volume is an activity gauge, nothing more. It tells you the market is awake. It does not tell you how much was traded or how deep the market is, so read "high volume" as "many updates", not as "plenty of liquidity".
This also applies to volume profile on a spot forex chart: at the broker our feeder uses, which reports no real volume, the only thing a profile can stack is tick volume.
What this article does not tell you
It does not measure liquidity directly. Our bars do not store the spread, so the steps per tick are an indirect trace of depth, not the depth itself. Pips per 100 ticks is our own measure, total range divided by total ticks, and we have not checked whether the bars are built from the bid or the mid price.
The ticks are one broker's: another broker's feed will count a different number of updates for the same minute. And all the data is from summer time in the US, when the rollover falls at 21:00 UTC; in winter it moves to 22:00. None of the three is a buy or sell signal.