What is Smart Money Concepts (SMC)?
Smart Money Concepts (SMC) is a discretionary price-action framework popularised online, reframing classic support/resistance as zones where large institutional 'smart money'…

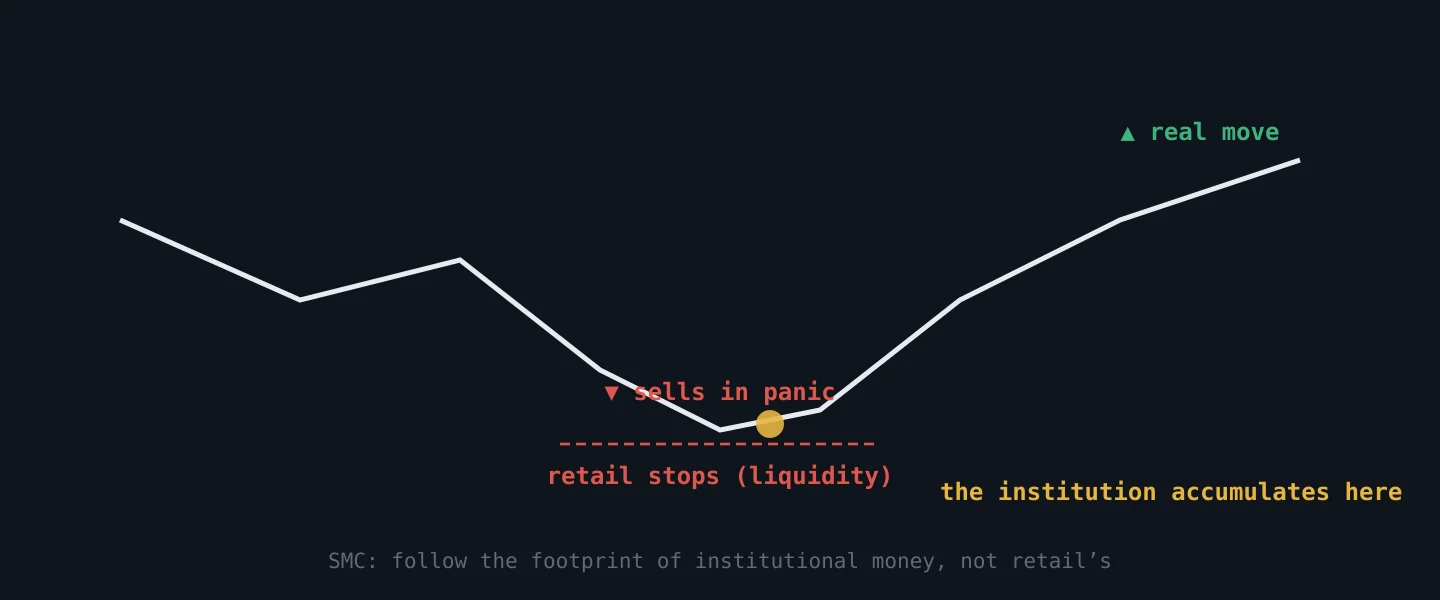
Smart Money Concepts (SMC) is a discretionary price-action framework popularised online, reframing classic support/resistance as zones where large institutional 'smart money' orders are thought to sit. It provides a way to read market context and build a directional bias using key building blocks, but it is not a mechanical buy/sell system or officially endorsed by any institution.
What are the core components of SMC?
SMC is not one indicator, it is a vocabulary. These are the pieces you actually need, and what each one claims:
- Market structure — the sequence of swing highs and lows, read through Break of Structure (BOS, continuation) and Change of Character (CHoCH, possible reversal). This is the backbone; everything else hangs off it.
- Liquidity — the resting stop orders above obvious highs and below obvious lows. SMC treats these clusters as targets, not accidents.
- Order blocks — the last opposing candle before a strong move, marked as the area where the move was originated and where price may return.
- Fair value gaps — a three-candle imbalance where price moved so fast it left no overlap, often revisited later.
- Premium and discount — the top and bottom halves of a range. The rule of thumb is to sell in premium and buy in discount, never the reverse.
- Inducement — the obvious-looking setup that exists to trap breakout traders before the real move.
- Supply and demand zones, mitigation blocks and the wider ICT methodology it grew from, including the Market Maker Model (AMD), refine the entry once the bias is set.
Our desktop app draws order block and fair value gap overlays on its TPO / Market Profile charts, which saves marking them by hand.
How does SMC read a chart differently?
Classic technical analysis asks where price stopped. SMC asks why it went there in the first place.
Take a double top. Traditional reading: a resistance level held twice, so sellers are in control. SMC reading: the two highs left a shelf of stop-loss orders just above them, and that shelf is a pool of guaranteed liquidity — a place where a large buyer could be filled without pushing the price against themselves. Under that lens, the market is not avoiding the level; it is likely to be drawn to it, take it, and then reverse.
That single reversal of the question is what the whole framework is built on. It also explains why SMC traders are relaxed about a level breaking: a stop run above the highs followed by a close back below is not a failed resistance, it is the setup.
How do you apply SMC to a trade?
Structure gives the bias, the zone gives the entry. Walked through on GBP/USD.
Price has been rising and prints a high at 1.2750, then pulls back to 1.2705. Days later it pushes up again and pokes through to 1.2762 — but closes back below 1.2750. That is a liquidity sweep: the stops above the old high were taken and there was no follow-through.
The bias does not flip yet. It flips when price then closes below 1.2705, the higher low that defined the uptrend. That close is the CHoCH, and now the read is bearish.
The entry does not come from the CHoCH itself. You mark the order block that produced the drop — the last up-candle before the sell-off, say the 1.2735 to 1.2745 area — and wait for price to retrace into it. Entry there, around 1.2738. The stop goes above the sweep high at 1.2765, because a close above that invalidates the whole story. That is 27 pips of risk, against the obvious pool of sell-side liquidity resting under the range lows near 1.2640.
Notice how much of the work happened before the entry. SMC is mostly a way of deciding which direction to look, not a trigger.
What does SMC get right, and what is unproven?
This is worth separating honestly, because the framework mixes the two.
What holds up: stop orders really do cluster around obvious highs and lows, price really does return to areas it left quickly, and ranges really do have halves that behave differently. Those are observable on any chart, and they predate SMC — most of it is Wyckoff's accumulation and distribution in newer clothing.
What does not hold up as stated: no retail chart can show you that a specific institution placed a specific order in a specific block. The order-flow story is an interpretation laid over the price pattern, not data. When someone tells you "the banks are accumulating here", they are describing a candle, not a ledger.
You can use the framework without believing the story. We set out the full case — what SMC gets right, what is unproven, and how much is renamed Wyckoff — in our review of the evidence on SMC.
What is a common beginner mistake with SMC?
Treating it as a mechanical system. SMC is discretionary. Two competent traders will mark different order blocks on the same chart, and neither is wrong. If you are looking for rules that remove judgement, this framework will frustrate you.
Marking every candle as a block. A chart with fourteen order blocks and nine fair value gaps has no information in it. The zones that matter are the ones that produced the move you are trading.
Skipping the structure and going straight to the entry. The order block is the last step, not the first. Without a BOS or CHoCH to set the direction, a block is just a rectangle.
Trading the vocabulary instead of the market. Naming a pattern is not analysis. A dead session with no volume behind it is a bad trade even when every SMC box is ticked, which is why it pays to weigh the wider context — an MRS read, or the CTS when the pair has a rate story behind it.
The takeaway
SMC is a lens, not a signal generator. Its real contribution is the question it asks — where is the liquidity, and what is price likely to be drawn toward — and its real risk is the confidence its vocabulary lends to a guess. Learn the building blocks, use the structure to set direction and the zones to time entries, and stay sceptical of anyone who tells you what the banks are doing.