Which tick model did that backtest use, and why does it change the result?
MetaQuotes' own documentation explains how its "1 minute OHLC" mode can manufacture a "Testing Grail". What does the robot see in each mode? The mode worth asking for, depending on the strategy, and a robot published in 2011 that still proves it.
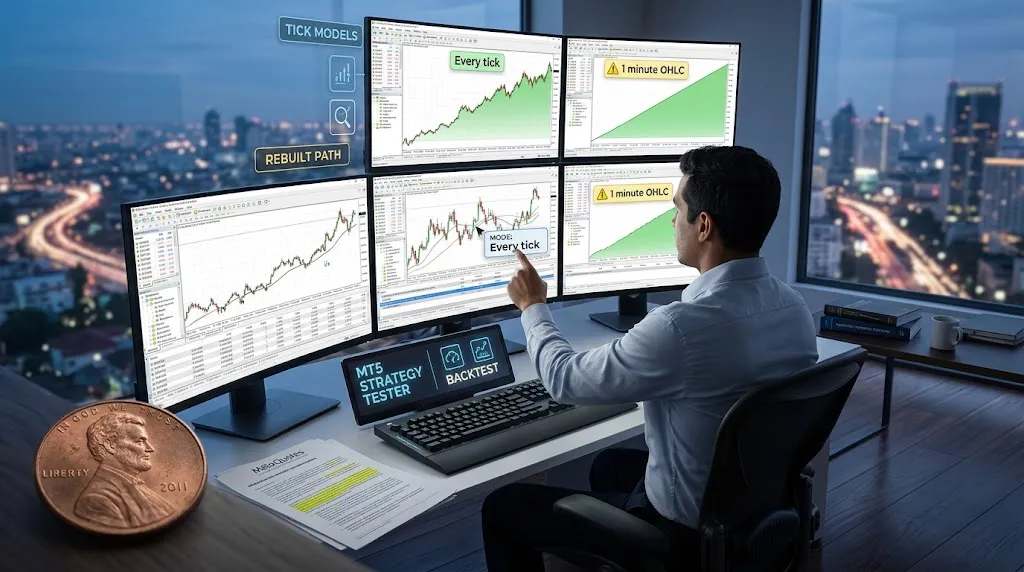
A MetaTrader 5 (MT5) backtest only tests the robot against the ticks that actually happened in one of its modes, and not in every minute even there. The others rebuild what went on inside each candle, in more or less detail, and that rebuild can manufacture a result that does not exist. That is not our claim: the MetaQuotes documentation explains how one of its modes makes it possible to build a "Testing Grail".
What does the simulator not know about a one-minute bar?
The Strategy Tester works on one-minute bars, and for each one it knows four prices: the open, high, low and close (OHLC). What it does not know is the path. The MQL5 technical documentation, MQL5 being MetaQuotes' programming language, puts it this way: the price is known to have passed through those four points, but not the second it reached the high or the low, nor which of the two came first.
A lot fits inside a minute. We measured that path in how much price moves in one minute, and for a strategy with a tight stop it is exactly where the trade is decided.
Each test mode fills that gap differently. That is why the same robot, on the same data, can produce opposite reports.
How do the modes differ?
| Mode | What the robot sees | Use |
|---|---|---|
| Every tick based on real ticks | The ticks the broker recorded | The closest to the market |
| Every tick | Ticks generated between the four prices | Strategies that depend on the path |
| 1 minute OHLC | Only the four prices of each minute | Quick estimates |
| Open prices only | Only the open of each bar | Strategies that decide at the bar open |
| Math calculations | No prices at all | Mathematical calculations, no market |
The difference is not one of decimal precision. It is about what information the robot has at each instant, and a robot can exploit that information even though it does not exist in the real market.
How do you manufacture a grail with "1 minute OHLC"?
In this mode the simulator generates no intermediate ticks: the robot only receives the four prices of each minute, always starting with the open and ending with the close. The documentation describes the consequence:
The refusal to generate additional intermediate ticks between the Open, High, Low, and Close prices, leads to an appearance of rigid determinism in the development of prices, from the moment that the Open price is determined. This makes it possible to create a "Testing Grail", which shows a nice upward graph of the testing balance.
The mechanism is simple. After the open, the next price can only be the high or the low. If it is the low, the next one will be the high: buy at the low, close the buy at the high and open a sell there, and close that sell at the last price, which is always the close. If the high comes first, the same happens in reverse. Every candle becomes two trades whose result is known before they are opened.
The documentation links to a real example published in its code library: Grr-al, a robot uploaded by a community author on January 5, 2011. Its own page says it openly: it is only profitable in the "Open prices only" and "1 minute OHLC" modes. And the documentation describes what happens outside the simulator:
When testing such EA on the history, everything goes smoothly, but once we launch it online, the truth begins to get revealed - the balance line remains steady, but heads downwards.
As of September 16, 2026, the page records 10,862 downloads. Among its comments is a user who tried it on a demo account and says they lost, and another from January 2025 asking why the backtest only wins in those two modes and not in "Every tick". Fourteen years after it was published, the demonstration was still surprising people who did not know how each mode generates its ticks.
What does "Open prices only" hide?
It is the fastest mode, and the documentation explains why: the robot only acts at the open of each bar. The simulator generates ticks from the four prices of the chosen timeframe (on weekly and monthly, those of each day), not of the minute, and the remaining ticks are hidden from the robot.
It has three consequences a report does not show:
- Stops and pending orders can fill at a price different from the one set, especially on higher timeframes. That is what decides whether a stop-loss protects you or not.
- It does not allow random delay, so the test cannot simulate variable waits in execution.
- The robot cannot read data from a lower timeframe than the one being tested.
What it is good for, the documentation makes clear: strategies that only trade at the bar open, with no pending orders and no stops. Its example is the moving-average robot that ships with the platform, which gives exactly the same result in all three modes in a test on the EUR/USD hourly chart (H1) between September and December 2010.
Is "Every tick" the real market?
No. It is the most accurate of the modes that generate ticks, and the name invites you to think otherwise. Between the four prices of each minute the simulator adds generated control points, and the robot receives each one as if it were a real tick.
The documentation itself presents it as the most accurate and the slowest mode, and adds that for an initial test of most strategies one of the other two is usually enough. It is about a first pass, not about the result you rely on.
Not even real-ticks mode is free of rebuilding: it fills with generated ticks the minutes that do not match their bar and those with no ticks at all. A real-ticks report can carry rebuilt stretches inside it.
Which mode should you ask for, depending on the strategy?
- If it trades inside the candle — scalping, stops a few pips away, grids — real ticks. Any other mode rebuilds precisely the stretch where it wins or loses.
- If it only decides at the bar open and uses no stops or pending orders, "Open prices only" can be enough, and the documentation backs that.
- If the result is spectacular in a rough mode, the rule is MetaQuotes' own: rerun it in "Every tick" before you believe it.
And if the report comes from MetaTrader 4, it is a different conversation: there the figure on show is "modelling quality", which we explained in The robot is not sold for what it earns. A good tick mode will not save an overfitted system either: it only stops the simulator from adding its own fiction on top.
What this article does not tell you
We have not run tests of our own in MT5, and we do not know which mode any particular robot on sale used. Grr-al is a declared demonstration, published with its warning, and we do not claim any vendor uses that trick.
What it does give you is the question that comes before all the others. A balance curve without its tick mode cannot be read, and the maker of the simulator itself tells you what to do when it looks too good.