What was Black Monday 1987?
The Dow fell 22.6% in a day and it is still the record. The odd part: the market's fear gauge did not exist yet — 1987 is why it was built.
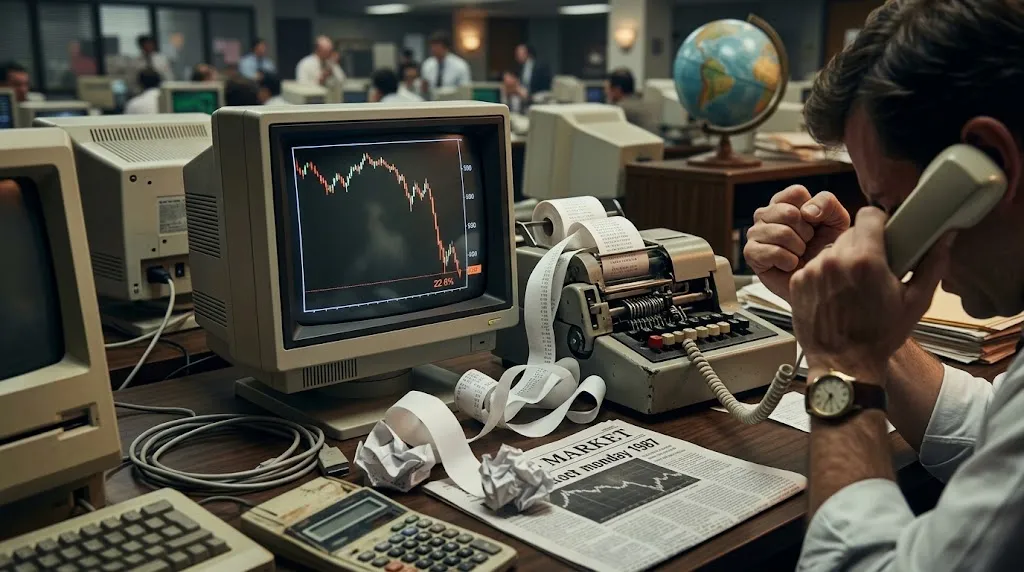
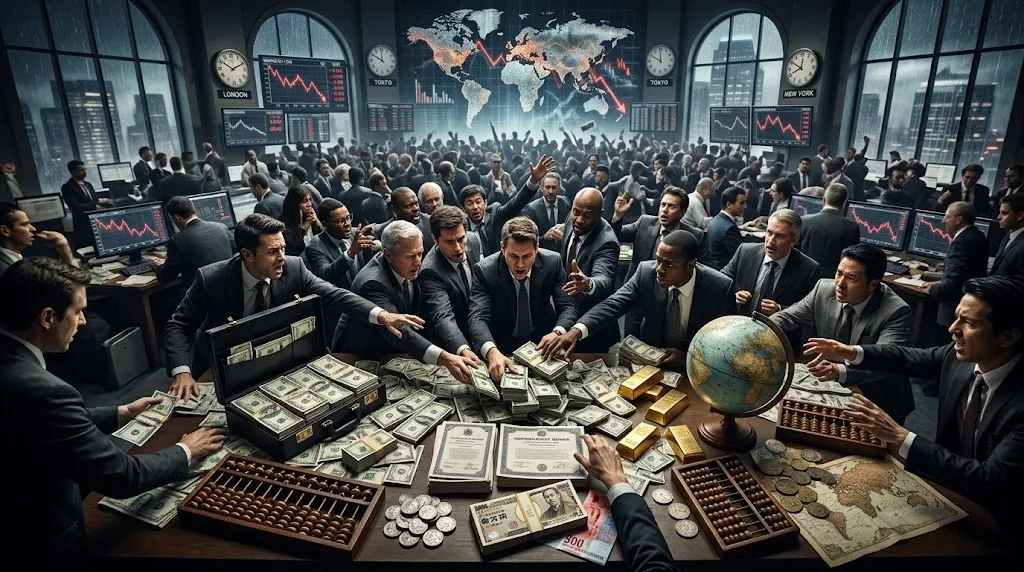
On Monday 19 October 1987 the Dow Jones Industrial Average fell 508 points, from 2,246.74 to 1,738.74 — a drop of 22.6% in a single session. Almost forty years and several crises later, it is still the largest one-day percentage fall in the index's history. And the instrument every trader now checks to measure fear did not exist that day.
What happened on 19 October 1987?
There was no single trigger — no bankruptcy, no war, no central bank announcement that morning. What there was: a market that had run hard all year, and a wave of automated selling programs that sold more as prices fell, which pushed prices down further, which triggered more selling. The mechanism mattered more than the news. Economists still argue about how much of the fall those programs caused, which tells you something about how hard it is to name a cause even with decades of hindsight. Not everyone was caught flat: Paul Tudor Jones had already positioned for a fall before it arrived, on the strength of a chart overlay rather than a headline — which is the rare call that only looks obvious afterwards.
How far did it spread?
It was not an American event. The S&P 500 lost about 20%. Hong Kong fell 45.8%, the worst of any major market. Australia and Singapore also fell more than 40%, and New Zealand dropped into the 30s — the same market and the same month in which Andrew Krieger was shorting the New Zealand dollar. A shock in one time zone rolled into the next as each session opened, which is the oldest illustration there is of why a 24-hour market transmits panic so efficiently.
The fear gauge that did not exist yet
Here is the part most people miss. The VIX — the index traders now quote as shorthand for "how scared is the market" — was not published until 19 January 1993. It was developed by the academic Robert Whaley at the request of the Chicago Board Options Exchange, and the conversations that led to it came directly out of 1987, when the implied volatility priced into some options reached levels nobody had a way to summarise. In other words: the market's most famous fear indicator exists because of its most frightening day. If you want the mechanics, we cover it in our explainer on the VIX and forex.
What does it mean for you?
Two things, and neither is "a crash is coming". First, the worst day on record had no headline attached — so a calendar with nothing red on it is not the same as a safe day. Second, 1987 is the reason volatility is measured at all, and measuring it is what lets you size a position against how much a market is actually moving rather than how confident you feel. That is the whole argument for letting ATR and timing do the work instead of predicting direction.
This is historical storytelling, not investment advice.