USD/CAD: how much does it move, when, and what moves it?
The most uneven day in the series: a best hour worth 3.5 times the worst, and 67% of the range inside four hours. The only major with both currencies in one time zone.
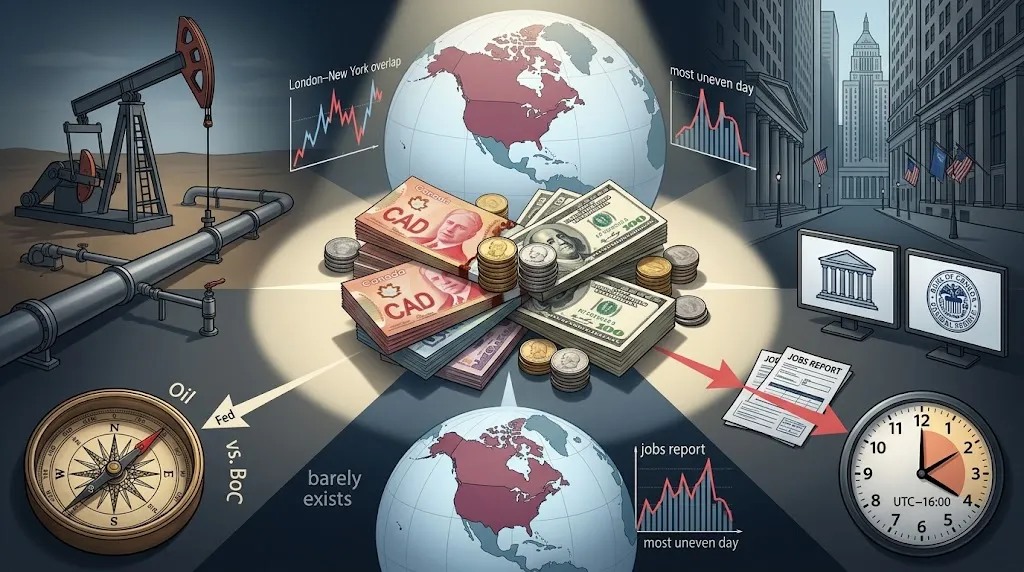
USD/CAD has the most uneven day in the series: its best hour is worth 3.5 times its worst, more than any of the six pairs, and 67% of its range falls inside the four hours of the London–New York overlap.
There is a simple, geographic reason: it is the only major whose two currencies live in the same time zone. When North America sleeps, nobody is left who cares.
How the numbers were built. Hourly bars from January 2021 to September 2026. The headline figures use the last two years, 521 Monday-to-Friday days, with Sundays excluded because in UTC they hold only the first two or three hours of the week. Every hour below is UTC.
How much does USD/CAD move in a day?
| Kind of day | Range |
|---|---|
| Very quiet (10th percentile) | 35 pips |
| Quiet (25th percentile) | 45 pips |
| Typical (median) | 59 pips |
| Busy (75th percentile) | 80 pips |
| Very busy (90th percentile) | 112 pips |
At 59 pips of median range it sits between USD/CHF and EUR/USD: 17% of its days fail to reach 40 pips and 14% clear 100.
| Pair | Median daily range | Days under 40 pips |
|---|---|---|
| USD/CHF | 53 pips | 24% |
| USD/CAD | 59 pips | 17% |
| EUR/USD | 64 pips | 15% |
| GBP/USD | 80 pips | 5% |
| USD/JPY | 112 pips | 4% |
⚠️ That table compares pips, not money. To convert it there is the position size calculator, and the unit is explained in our guide to pips and their value.
What hours is it genuinely alive?
| Window (UTC) | Median range per hour |
|---|---|
| 22:00–05:00 · Asia | 6 to 9 pips |
| 06:00–08:00 · London opens | 10 to 12 pips |
| 09:00–11:00 · European morning | 9 to 11 pips |
| 12:00–16:00 · London–New York overlap | 14 to 21 pips |
| 17:00–21:00 · New York afternoon | 10 to 12 pips |
Here is the pair's signature. Peak at 14:00 UTC with 20.7 pips, trough at 04:00 with 5.9: a 3.5-fold gap, wider than any other in the series. And 67% of the daily range inside the overlap, the highest of the five we measure directly — only GBP/JPY concentrates more, and that is a derived series.
Set it against USD/JPY, which splits its day across two peaks and concentrates only 53%. They are the two ends of one scale: a pair with two time zones behind it, and a pair with one.
The operational consequence is the clearest in the series: outside those four hours, USD/CAD barely exists. Six median pips at 04:00 UTC does not fund a trade with costs. The map is in forex trading sessions and in session overlaps; live, on the session clock.
What moves USD/CAD?
- US data. In the hour non-farm payrolls are released its range is 2.26 times its range for that same hour on an ordinary day, with EUR/GBP as the control at 1.30. And there is an aggravating factor unique to this pair: Canada publishes its own jobs report on the same day and at the same hour as the United States, so this pair takes both at once. To size a position with that coming, the news risk calculator.
- The Federal Reserve (the Fed) against the Bank of Canada (BoC), two central banks reading the same economy from opposite sides of a border. A concrete episode is in trade, energy and the Fed–BoC divergence.
- Oil, because Canada exports it and the United States consumes it. ⚠️ This is the one factor in the series we cannot measure: our price history holds currencies and metals, not crude. So it is stated as a mechanism, with no number of ours behind it. What exactly people mean by "oil" is in Brent vs WTI.
What does not move it, despite appearances?
It is not a mirror of EUR/USD, however much the dollar out front suggests it. Their correlation is −0.60: real, but it leaves 64% of the movement unexplained. The genuine mirror is USD/CHF at −0.83.
What it does resemble is that same USD/CHF: +0.55 between them. Both are, above all, ways of betting on the dollar, and they are better counted as one position than as two.
Is it a good pair to start on?
Yes, if your hours fit. It is one of the calm ones, it does not lurch the way GBP/JPY does, and its behaviour is among the most predictable in the series precisely because it is so concentrated: you know with fair reliability when it is going to move.
The flip side is that those hours are not negotiable. If you can only trade the European morning or the small hours, this pair will hand you 6 to 11 pips an hour, and there the spread takes a share the figures above do not deduct. Size with ATR (Average True Range), which adjusts to the weeks in progress.
What these numbers do not tell you
- Oil is left out. It is a real driver of this pair and we have not measured it, because we do not hold the crude series. Saying so is more honest than estimating it.
- The median is not your day. It describes the centre of a distribution, not what happens tomorrow.
- No spread and no slippage are inside it. Our history stores prices, not costs.
- The granularity is one hour, so a five-minute spike is invisible.
- This is not a forecast. It describes how the pair has behaved; the past shapes the expectation, never the outcome.