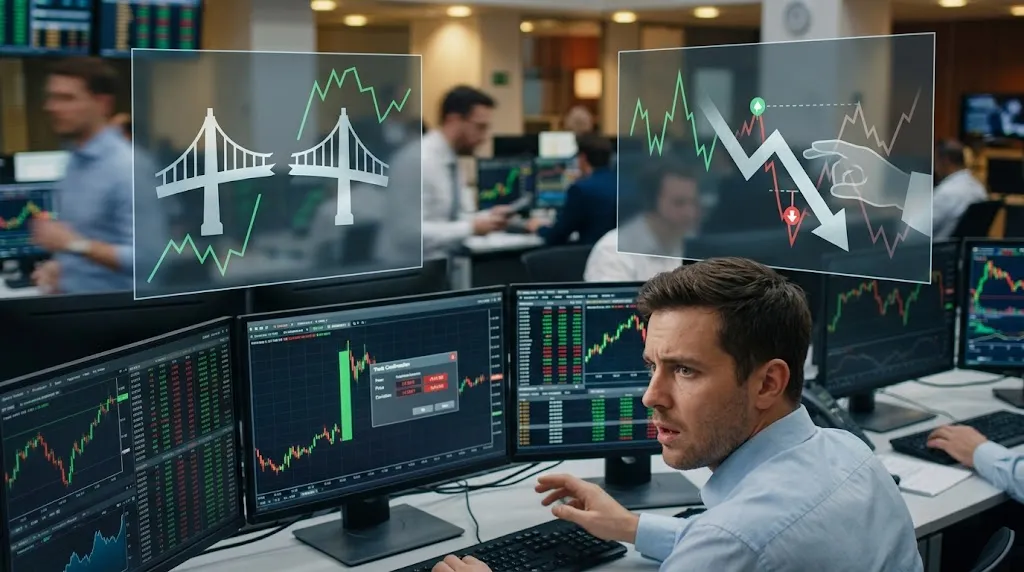
What are momentum oscillators? RSI, stochastic and MACD
The RSI, the stochastic and the MACD measure the strength of a move, not its direction. Learn what each one measures, the signal that actually matters (divergence), and the mistake that wrecks beginners.

A momentum oscillator doesn't tell you where price is going — it tells you how hard it's moving, and when that force starts to fade. The RSI, the stochastic and the MACD are the three most used. They share the same logic and the same beginner mistake: thinking "overbought" means "sell now." This guide covers what each one measures, the signal that actually matters (divergence), and how this same idea, applied to the whole market, is the foundation of indicators like the FOTSI.

What does a momentum oscillator measure?
The speed of price, not its direction. Think of a car: price is where you are; momentum is how fast you're going and whether you're accelerating or braking. An oscillator takes that "speed" and plots it in a panel below the chart, usually between two extremes. When it reaches high, the up-move is stretching; very low, the down-move. It isn't a buy or sell order — it's a thermometer of how much fuel the move has left.
How does the RSI work?
The RSI (Relative Strength Index) is the most famous one. It moves between 0 and 100 and compares the strength of recent gains against recent losses. The classic reading: above 70 is overbought (gains dominate and may be running out) and below 30, oversold. It's an at-a-glance lens for whether a pair has moved too far, too fast.

How is the stochastic different?
The stochastic also runs 0 to 100 (with zones at 80 and 20), but it measures something else: where price closes within its recent range. If it closes near the top of the range, the stochastic rises; near the bottom, it falls. It uses two lines, %K (fast) and %D (its average, slower), and many traders watch the crossover between them. It's faster and noisier than the RSI: more signals, but more false ones too.

And the MACD?
The MACD (Moving Average Convergence/Divergence) is different: it isn't bounded between 0 and 100. It subtracts two exponential moving averages (one fast, one slow), and that result is the MACD line; on top of it sits a signal line (its own average) and a histogram measuring the gap between the two. When the MACD line crosses above the signal line, momentum turns up; below, down. The histogram growing or shrinking tells you whether the force is building or fading. It blends momentum and trend in a single panel.

The signal that actually matters: divergence
It's the most valuable thing the three of them give, and it works the same on all of them. Divergence is when price and the oscillator don't tell the same story: price makes a higher high, but the oscillator makes a lower one. Translation: price keeps rising, but with less force each time — the move is running out of fuel, even if the chart doesn't show it yet. Divergence isn't an entry order, but it's one of the earliest warnings that a trend may be tiring.

The beginner's trap
This is where almost everyone gets lost: believing overbought = sell and oversold = buy, automatically. It doesn't work that way. In a strong trend, the RSI can stay pinned above 70 for weeks while price keeps climbing — selling just because it's "overbought" is fighting the trend. The correct read is the same golden rule as candlesticks and support and resistance: an oscillator is a hint, not an order. It's worth something when it confirms what you already saw on the chart, not on its own.
From one pair to the whole market
An RSI or a stochastic measures the momentum of a single pair. What if you applied that same idea to all 8 major currencies at once? That's exactly what the FOTSI oscillator does: it uses the True Strength Index —a momentum oscillator— across 28 pairs to rank the currencies strongest to weakest. It's the RSI idea, applied to the whole market instead of one chart. And the FSI index takes the same principle to sentiment: it measures the momentum of the market's fear and greed.
The bottom line
The RSI, the stochastic and the MACD measure the same thing with different methods: the strength of a move and when it fades. The RSI compares gains and losses; the stochastic, where price closes in its range; the MACD, the gap between two averages. The signal they share and value most is divergence. And the rule that never changes: they are thermometers, not buy buttons. Use them to confirm what you already see —a reversal candle, a key level— and you'll have gone from watching the indicator to reading the market.