What are support and resistance?
Support and resistance are the price levels where a market has repeatedly stalled or reversed — the foundation almost every other technical tool is built on.

Support and resistance are the price levels where a market has repeatedly struggled to fall below or rise above. Support is a floor where buyers keep stepping in; resistance is a ceiling where sellers keep taking over. They are the most basic idea in technical analysis, and almost every other tool — moving averages, Fibonacci, trendlines — is just a different way of finding them.
Why do these levels work?
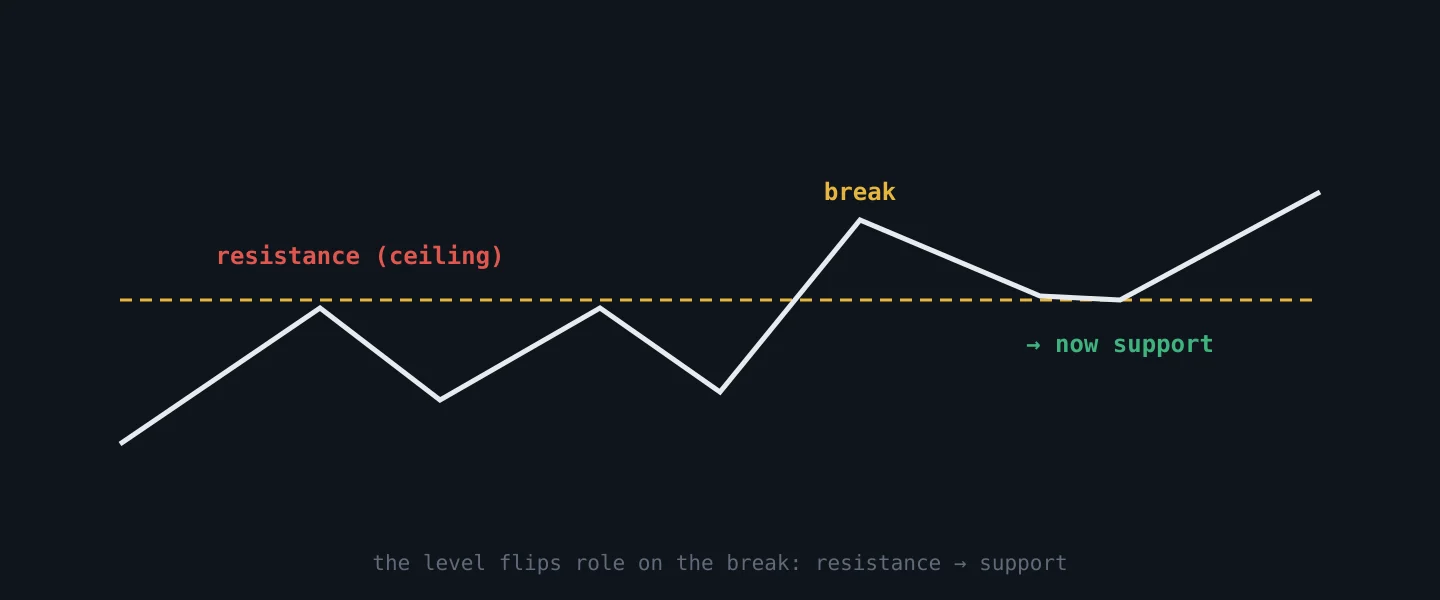
Because markets have memory. A price where buyers once rushed in is a price where they may do so again — traders remember it, place orders around it, and the level becomes self-reinforcing. When a level finally breaks, it often flips role: old resistance becomes new support, and vice versa.
There is a mechanical reason underneath the psychological one. Around an obvious level sit real resting orders: limit buys from traders who want in cheaper, stop-losses from traders who are already short, and take-profits from everyone who bought lower. That cluster is liquidity, and price reacts there because there is something to react to.
Note that none of this is specific to currencies. The same levels work on stocks, indices and commodities, for the same reason: they come from participant behaviour, not from the asset.
How do you actually draw a support or resistance level?
This is where most charts go wrong, and it comes down to four habits.
- Draw a zone, not a line. Price rarely turns at one exact number. Use the cluster of candle bodies as the core of the zone and let the wicks define its outer edge. A level is a neighbourhood, not an address.
- Two touches make a candidate, the third confirms it. One reaction is coincidence. The level earns attention when price returns and behaves the same way again.
- The reaction has to be visible. If price left a level without producing any move worth noticing, breaking it later proves nothing. A level nobody defended was never a level.
- Higher timeframes outrank lower ones. A daily level beats a 5-minute level every time. Mark structure on the timeframe your decisions live on, then drop down only to time the entry.
One nuance worth knowing, because it splits experienced traders: does a level get stronger every time it holds? The common view is yes — more touches, more attention, more orders. The counter-argument is that each test consumes the orders sitting there, so a level tested five times may have very little left to defend it. Both are true at different points. Treat the first two or three tests as confirmation and the fifth as a warning that the floor is getting thin.
How do moving averages and Fibonacci fit in?
They are two ways of finding the same thing when there is no obvious horizontal level to use.
A moving average plots the average price over the last N periods — the 50-day and 200-day are the most watched. Traders use them as dynamic support and resistance: instead of a flat line, the level rises or falls with the trend. Price pulling back to a rising 200-day average and bouncing is the same idea as bouncing off a floor, just a moving one.
Fibonacci retracement addresses the other case. After a strong move, markets rarely go straight — they retrace part of the way before continuing. The tool draws horizontal levels at set percentages of that move (38.2%, 50%, 61.8%) to estimate where the pullback might find support. It is not magic math; it works partly because so many traders draw the same levels and act on them, which is the self-reinforcement above in another costume.
How do you trade a support level?
Say EUR/USD sold off to 1.0850 in March, bounced, came back in April and bounced again. The wicks on those two visits reached 1.0838 and 1.0844, so your zone is roughly 1.0838 to 1.0860 — not a line at 1.0850. Price is now approaching it for a third time.
A trader working that zone does not buy on touch. Buying the touch assumes the level holds; the whole point is that you do not know yet. They wait for price to enter the zone and show rejection — a candle that dips in and closes back above 1.0860 — and enter on that close, say at 1.0865.
The stop goes below the entire zone, not below the entry: 1.0830, under the deepest wick. That placement is the reason the zone matters, because a close beneath it means the read was simply wrong and there is no point paying to find out twice. That is 35 pips of risk. Overhead, price stalled twice near 1.0975, which gives 110 pips of room — better than three to one.
Notice what the level actually did there. It did not predict the bounce. It supplied a place to be wrong cheaply, which is the only thing any level can honestly offer.
What happens when a level breaks?
The zone flips. A close below 1.0830 turns old support into new resistance, and the retest from underneath becomes a short setup with the same logic in reverse.
The hard part is telling a break from a fake. Price frequently dips just below an obvious floor, collects the stop orders resting there, and closes straight back inside the zone. That is a liquidity sweep, not a breakdown, and it is the same trap as inducement: the move exists precisely because everyone could see the level.
The filter is the close, exactly as it is for a break of structure. A wick through the zone is a test. A close beyond it, on the timeframe you are working, is a break.
The mistakes that cost beginners money
Drawing lines instead of zones. A one-pixel line makes every test look like a failure or a miracle. The wicks are not noise to be trimmed — they are the edge of the zone.
Buying the touch instead of the rejection. Entering as price arrives at support is a bet that it holds. Entering after it rejects is a bet on something that already happened.
Marking every pivot on the chart. Ten levels on a screen means no levels. Keep the ones that produced a visible reaction and delete the rest.
Reading the level without the context. The same zone means different things in a dead session and in a violent one, which is why it pays to check volatility before sizing the trade, and currency strength to know which side of the pair has the wind behind it.
The takeaway
Support and resistance are simply the prices where a market has paused before, and they work because real orders sit there. Horizontal zones, moving averages and Fibonacci are three ways of finding them. None is a crystal ball: a level does not tell you what price will do, it tells you where you will find out quickly and cheaply whether you were right.