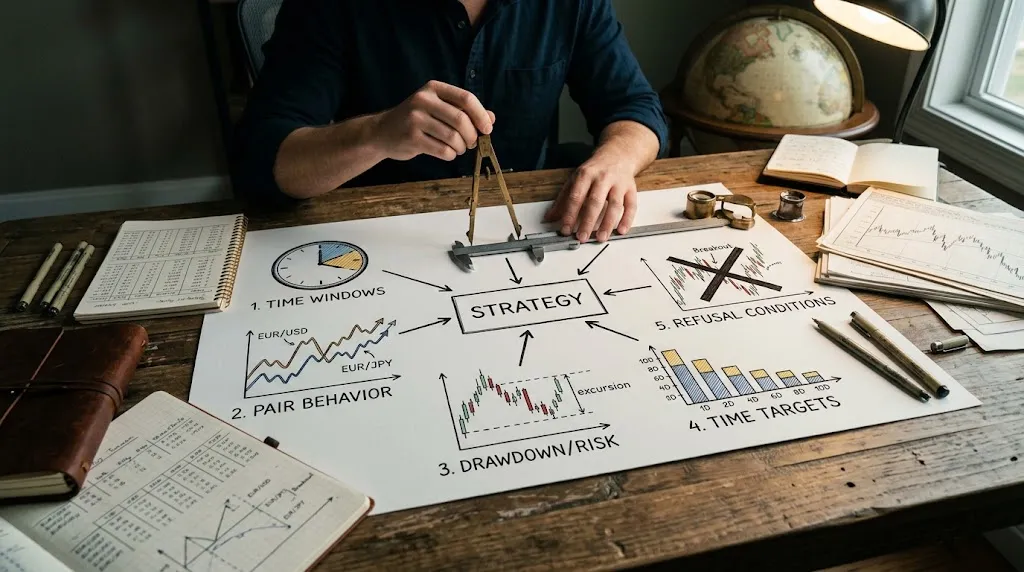
What does trading the news demand?
In the NFP hour the candle widens by a median of 2.35 times, across 469 cases. Trading the news does not ask for your time: it asks you to stomach your risk doubling in the release hour.

In the hour of the non-farm payrolls (NFP) release, the candle widens by a median of 2.35 times what that same hour measures on a normal day. That number is the whole question: trading the news does not ask you for more hours than any other style, it asks you to stomach your risk doubling in the release hour.
The release is not the opportunity — the width is
Almost everything written about trading the news is about how to guess the direction. This post is not about that — for the how, we already have a practical guide to the economic calendar. This is about whether the style suits you, and answering that takes a single figure: how much more price moves in that hour.
We measured it on our own hourly candles, from January 2021 to September 2026. Method: the range of the candle containing the release, divided by the median range of that same hour across the 45 days either side, excluding other payroll days. So the number compares against that hour in normal conditions, not against "some hour".
How much wider, exactly?
Only the NFP can be isolated by rule — first Friday of the month, 8:30 New York — so it is the event we measured. Each pair contributes 67 cases.
| Pair | Multiplier in the release hour |
|---|---|
| NZD/USD | 2.62 |
| AUD/USD | 2.58 |
| EUR/USD | 2.39 |
| USD/JPY | 2.32 |
| USD/CAD | 2.26 |
| USD/CHF | 2.23 |
| GBP/USD | 2.08 |
| EUR/GBP (control, no dollar) | 1.30 |
Pooling the seven dollar pairs: n=469, median 2.35, with the worst 25% above 3.46 and the worst 10% above 4.56.
The EUR/GBP row is what makes the rest believable. It has no dollar on either leg, so a US employment release should barely touch it — and indeed it stays at 1.30. Had that control come out like the others, the measurement would be wrong and this post would not exist.
What does that do to your stop?
If you size the position on that hour's normal volatility — with ATR, say — and then trade the release, your stop is calibrated for a world that lasts until 8:29. The median says you would need more than double the room; the 90th percentile says sometimes four and a half times.
That is the real cost of the style, and it is not the spread: it is that where you place your stop stops meaning what it meant. Either you widen it and take the same risk on a much smaller position, or you keep the size and accept being stopped out as a matter of routine.
What does the style demand?
Little time and a lot of stomach, which is the exact opposite of intraday. You do not need to sit there all afternoon: you need to be precise for a few minutes a month, with the position already sized before the number lands, and no option to rethink it while it happens.
It also demands accepting that execution is not the one you rehearsed: in that candle the spread widens and price jumps without visiting the levels in between. That is not your broker misbehaving, it is what a 2.35 multiplier means.
Who does it fit, and who does it not?
It fits someone short on time who can reserve specific calendar slots, already sizes by volatility, and does not need to trade every day. It fits badly anyone chasing frequency, anyone who cannot watch a position move two figures before it resolves, and anyone trading a size that only survives normal volatility.
And above all it fits badly anyone who believes the number will tell them the direction. The practical guide dismantles that, and the measurement confirms it: what you can anticipate is how much it will move, not which way.
What this post does not give you
- It only measures the NFP. It is the one event derivable by rule; the FOMC, the consumer price index (CPI) and generic high-impact releases follow no formula, and our historical calendar does not reach back that far.
- It does not measure spread or slippage. We do not store bid and ask prices, so the real execution cost in that candle is out of scope.
- A multiplier is not a direction. It measures width. A 2.35 says the range doubles, not that you will profit.
- The median falls short half the time. That is what the 75th and 90th percentiles above are for: the typical event is not the one that ruins you.
Pick a style for what it demands, not for what it promises
Trading the news is the cheapest style in time and the most expensive in nerve. Once you know you need more than double the room in that hour, the decision stops being a hunch and becomes arithmetic — which is exactly the argument in whether a perfect strategy exists at all. And the arithmetic leaves you two good exits, not one: size for the 2.35 — or for the 4.56 if you want to sleep — or stand aside for that one hour and trade the rest of the month as usual. Both are strategy decisions and both are defensible. The only bad one is entering that candle at the size of an ordinary day.