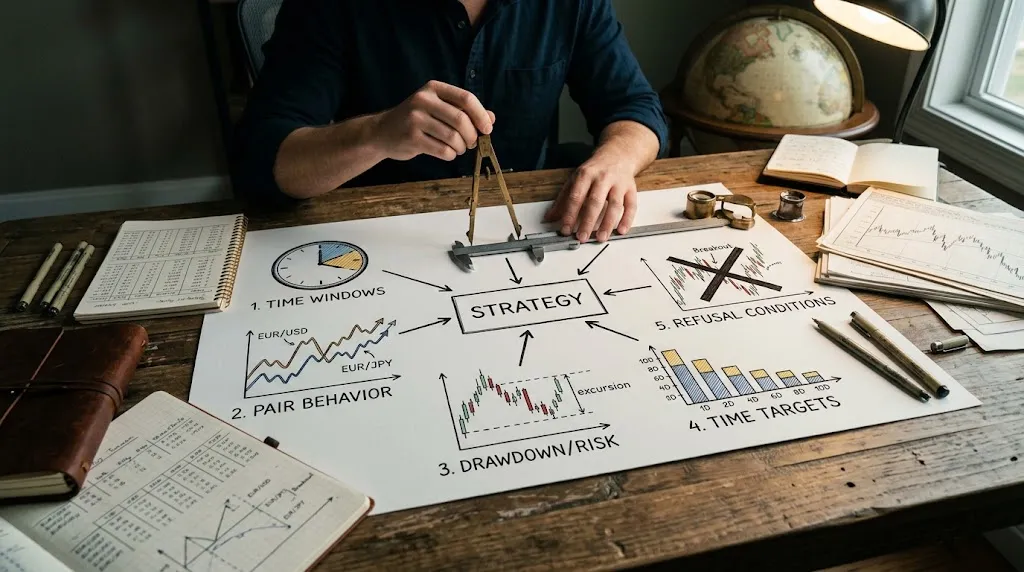
How much does price move if you hold for a week?
Holding ten days instead of one doesn't multiply the move by ten, but by 3.3. Measured across ten pairs and 5.7 years, together with the real size of the weekend gap.

Holding for ten days instead of one doesn't multiply the move by ten: it multiplies it by 3.3. Swing trading doesn't pay you for time in the market, and knowing what it actually pays is what decides whether the style fits you.
The intuition this figure breaks
The usual reasoning when someone moves to swing trading is arithmetic: if one day gives 28 pips, ten days will give a few hundred and there will finally be room for a decent target. That is the implicit promise of the whole style, and it is false in a measurable way.
We measured it with our own hourly bars: 5.7 years, January 2021 to September 2026, ten pairs and between 1,458 and 1,459 complete days per pair, Sundays excluded. For each pair we looked at the net close-to-close move across different horizons.
What time adds up to
The columns are the median net move, in pips, by how many business days you hold.
| Pair | 1 day | 2 days | 3 days | 5 days | 10 days |
|---|---|---|---|---|---|
| EUR/GBP | 15.5 | 21.5 | 27.3 | 35.4 | 50.5 |
| EUR/CHF | 19.1 | 25.7 | 30.6 | 39.7 | 59.8 |
| NZD/USD | 25.7 | 35.0 | 42.9 | 57.3 | 81.3 |
| AUD/USD | 25.8 | 36.0 | 45.5 | 59.0 | 81.6 |
| USD/CHF | 25.3 | 37.7 | 46.7 | 58.8 | 85.4 |
| EUR/USD | 29.3 | 40.7 | 51.9 | 67.2 | 97.4 |
| USD/CAD | 30.4 | 43.5 | 54.6 | 73.4 | 102.1 |
| GBP/USD | 37.3 | 55.7 | 65.4 | 84.5 | 127.3 |
| USD/JPY | 42.9 | 64.0 | 80.1 | 102.8 | 153.9 |
| EUR/JPY | 45.3 | 64.2 | 80.8 | 105.9 | 146.4 |
Expressed as a multiplier over the single day, all ten pairs say the same thing:
| You hold | Measured multiplier | Square root of the horizon |
|---|---|---|
| 2 days | ×1.42 | 1.41 |
| 3 days | ×1.79 | 1.73 |
| 5 days | ×2.29 | 2.24 |
| 10 days | ×3.32 | 3.16 |
The two numbers match almost exactly at all four horizons. The move grows with the square root of time, which is how the distance covered by a random walk grows. This is not a mathematical curiosity: it is the confirmation that time on its own contributes no direction. It contributes dispersion, and dispersion grows slowly.
And the weekend — how frightening is it really?
The other classic swing fear is sleeping with a position open over the weekend. Measured on the same pairs, with between 286 and 287 weekends each:
- The median gap between Friday's close and Monday's open is 11.1% of the median daily range. On EUR/USD that is 6.7 pips.
- The gap exceeds a full day's range on 1.0% of weekends.
So: the ordinary gap is a tenth of a normal day, and the gap that genuinely hurts shows up about once every two years per pair. It is a tail risk, not a daily one — and a tail risk is managed with position size, not by avoiding the style. The weekend gap post explains how to manage it; this one measures how big it is.
So what does swing trading demand?
It demands accepting an uncomfortable relationship: to double the move you have to quadruple the time inside. In practice, three things.
Targets proportional to the horizon. A 100-pip target on EUR/GBP is, per the table, a swing of well over ten days. On USD/JPY it is five.
Fewer trades, and therefore less cost. This is its real advantage over the fast styles: the spread is paid the same on every trade, but spread across a move more than three times larger it weighs more than three times less.
Very little screen time, but spread out. Swing trading doesn't ask for hours; it asks for check-ins. What it does ask for, heavily, is tolerance for watching an open position do nothing for days.
Who does it fit, and who does it not?
It fits someone who can't sit down during the active window — the problem that makes day trading unworkable for many people — someone with a high cost per trade, and someone who tolerates the uncertainty of sleeping with open risk. If reading the table makes you think ten days is still a short horizon, the next step up has its own measured price: how much do you sit through before a trend pays?. It fits badly anyone who needs to end the day flat to sleep, and anyone expecting the longer horizon to hand them big targets: it does hand them over, far more slowly than it appears.
What this post doesn't give you
- It measures movement, not profit. Price travelling 97 pips in ten days doesn't say you can capture them, or in which direction. These are medians of the absolute value: half the time the move is smaller.
- It doesn't measure financing cost. Holding for days pays or charges the rate differential every night. That is covered by the carry trade, and over one or two weeks it is usually small against the move, but it is not zero.
- Close to close, not high to low. Price travels considerably further than the table says; what the table measures is where it ends up, which is what a held position collects.
- We don't measure the spread. We store no bid and ask prices; that it weighs less is arithmetic of the split, not a measurement of ours.
- 5.7 years are not a forecast. Any given week can do anything.
Time is raw material, not return
The question about a style is never "how much does it make?" but "what does it ask of you?". Swing trading asks for patience and pays it at the square root of time: honest, but far less generous than intuition promises. If you do your arithmetic with ×10 in your head while the market pays ×3.3, you won't fail on technique — you'll fail because your targets never matched the available material. If the underlying question is still which strategy is the good one, the frame is in whether the perfect strategy exists at all. And that is the good news hiding inside the ×3.3: a rule that grows with the square root of time is a rule you can use. Take your pair's one-day range, multiply it by the square root of the days you plan to hold, and you have the target the market can actually pay you instead of the one you would like. Almost nobody sets targets that way, and it is one line of arithmetic.