Fundamental vs technical vs sentiment analysis: three ways to read the same move
Fundamental, technical and sentiment analysis answer different questions. We read one real session through all three: EUR/USD on US inflation day.

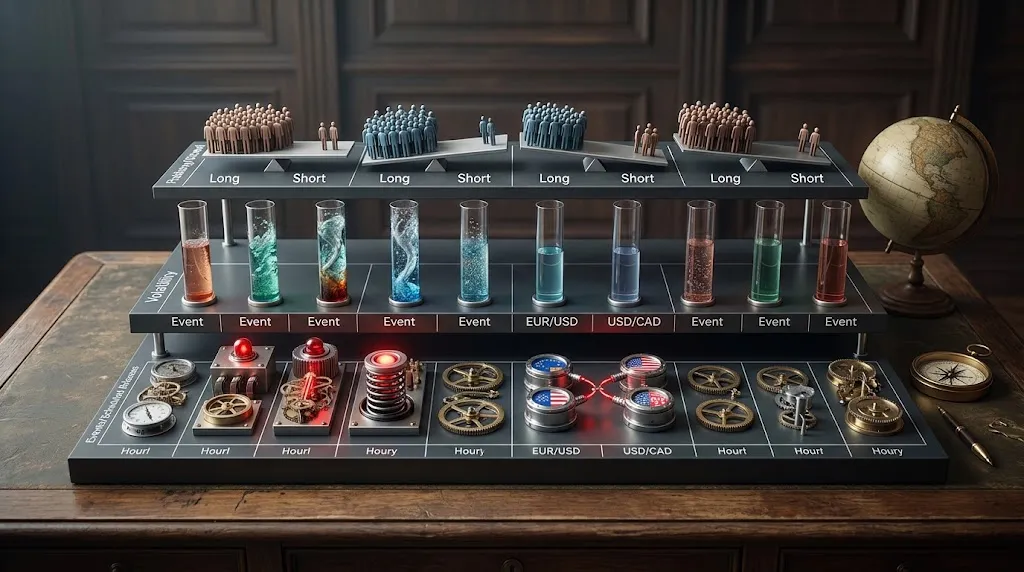
Fundamental, technical and sentiment analysis are the three schools traders use to decide what a currency is likely to do next. They are often sold as rivals, as if you had to pick one. They answer different questions, and on 14 October 2026 all three had something to say about the same move: EUR/USD's slide after a hotter US inflation report. This post puts them side by side and reads that one session through each.
Each one in one sentence
- Fundamental analysis asks why a currency should be worth more or less: interest rates, inflation, growth, central banks.
- Technical analysis asks where and when: it reads the price chart itself, its levels, trends and momentum.
- Sentiment analysis asks who is already positioned: how crowded a trade is, and on which side.
None of them is complete. A fundamental reason does not tell you the entry, a chart level does not tell you why the market cares about it, and a crowded position can stay crowded for weeks.
Side by side
| Fundamental | Technical | Sentiment | |
|---|---|---|---|
| The question | Why should it move? | Where and when? | Who is already in? |
| What it reads | Data releases, rates, central banks | Price: levels, trends, momentum | Positioning of traders and funds |
| Typical horizon | Weeks to months | Minutes to weeks | Days to weeks |
| Its blind spot | Timing: the market can ignore a reason for a long time | Cause: a level says nothing about why | Timing again: an extreme can last |
| On our blog | The economic calendar | Support and resistance, average true range (ATR) | The Commitments of Traders (COT) report, the Forex Strength Index (FSI) |
The horizons are typical uses, not rules. A fundamental trader can react within minutes to a data release, and a technical trader can hold a position for months.
One session, three readings: US inflation on 14 October
At 12:30 UTC on Wednesday 14 October, the US published its consumer price index (CPI) for September. EUR/USD had closed the session before at 1.11987 on our feed. What follows is the same move, read three ways.
The fundamental reading: inflation beat the forecast
The fundamental analyst starts with the number against what was expected. That gap, the surprise, is what moves price, as we explain in our guide to forecast, previous and actual.
| September CPI | Forecast | Actual | Previous |
|---|---|---|---|
| Headline, month on month | 0.6% | 0.6% | 0.4% |
| Headline, year on year | 3.6% | 3.7% | 3.4% |
| Core, month on month | 0.2% | 0.3% | 0.3% |
| Core, year on year | 2.5% | 2.6% | 2.4% |
Three of the four readings came in above forecast. The one central banks watch most closely for the underlying trend is core inflation, which strips out food and energy; we explain why in our piece on headline vs core inflation. Core beat on both measures.
The chain from there is the textbook one. Hotter inflation makes a rate hike by the US Federal Reserve (Fed) more likely, higher expected rates lift US yields, and higher yields draw money into the dollar, the mechanism behind how central bank decisions move currencies. Action Forex reported that the core reading pushed the odds of a Fed hike at the October meeting above 40%, with the 10-year US yield back above 5.30%.
The fundamental reading said the dollar should rise. It did not say how far, or where EUR/USD would stop.
The technical reading: two levels, and a stretched move
The technical analyst looks at the chart, and two levels were already on it. Our weekly wrap of 11 October opened on 1.1215, the line EUR/USD had broken on 7 October, and cited 1.1159, a level Action Forex had flagged.
On our feed, EUR/USD closed the last minute before the release at 1.11972. In the first minute after it, the pair fell to 1.11578, through 1.1159, and no one-minute close for the rest of the session came back above that level. The session low came at 15:08 UTC, at 1.11129, and the pair closed at 1.11569, down 0.37% on the session: still below 1.1159, and a sixth close in a row below 1.1215.
That is the technical reading of the same day: a level that gave way in the first minute after a catalyst, and a trend that continued. FXStreet's EUR/USD analysis that evening added the other half of the technical picture: the sellers were still in control, but the relative strength index (RSI), a momentum oscillator, was already in oversold territory. Many technical analysts read that as a move that has gone far, fast, not as a reason to buy.
The chart did not say why the level broke. A break with news behind it and a break without any look the same.
The sentiment reading: the crowd leaned against the fall
The sentiment analyst asks who was already positioned, and there are two very different crowds to look at.
Retail traders. According to Myfxbook's Community Outlook, which tracks the trading accounts connected to Myfxbook, EUR/USD was 84% long before the release. As the pair fell, that share rose, to 87% by 15:30 UTC, and it stayed there to the close. The crowd leaned further against the move.
Many traders read retail positioning as a contrarian signal: the idea is that when most retail accounts are on one side, the market tends to go the other way. On this day it did. Our Market Readiness Score (MRS) also treats lopsided retail positioning as a warning: the more one-sided it is, the higher that part of the score.
Leveraged funds. The COT report, published by the Commodity Futures Trading Commission (CFTC), counts the positions of leveraged funds in currency futures, in its Traders in Financial Futures (TFF) breakdown. In the latest report, for Tuesday 6 October, they were net short the euro by 44,261 contracts, up from 26,694 two weeks earlier. That put them at 17% of their range over the last 52 weeks, close to the bearish end; the most short they had been in that time was 65,198 contracts, on 28 July.
So the funds were already on the side the CPI favoured, and retail was on the other. But the COT is slow: those positions were eight days old when the CPI came out, and the first report to include the release covers Tuesday 20 October and comes out on Friday 23 October. Sentiment told you how crowded each side was, not when the move would come.
Where the three agreed, and where they did not
On 14 October the three readings pointed the same way: a fundamental reason for a stronger dollar, a broken level on the chart, retail traders on the wrong side of it and funds on the right one. Days like that are the easy ones to read.
They also disagreed on the detail, which is where each one earns its place. The fundamental reading gave the reason but no level. The technical reading gave the levels, and a warning in the oversold RSI, but no reason. The sentiment reading said who was exposed if the move continued, but on data up to eight days old.
What should you do with this?
- Use the calendar for timing. The fundamental reading starts with knowing what is due and when. A level means more when a release is about to test it.
- Use the chart for the plan. Entry and stop come from price, and size from that stop and the risk you take per trade. The ATR tells you how far a pair usually moves.
- Use sentiment as a check, not a trigger. A crowded position tells you where the pain is if you are wrong. It does not tell you when it will hurt.
- Check each pair for yourself. Our EUR/USD page puts the calendar for the next three hours and the retail positioning next to the price.
What this does not tell you
- One session, one pair. Three readings agreeing on 14 October says nothing about how often they agree. On many days they point different ways, and this post does not count those.
- Myfxbook is one community. Its Community Outlook covers the traders who share their accounts with Myfxbook, not the whole retail market.
- The COT was eight days old. It is a weekly report with a lag, and we used the latest one published.
- Timing is not proof. The euro fell in the first minute after the release, and the reports of the day tied the two. A single session cannot rule out everything else that happened at the same time.