Why does almost nobody make money day trading?
Between 67% and 97% of intraday traders lose money. The cause is not that markets are unpredictable: the gross result hovers around zero and what sinks it is cost, which scales with frequency.

The data agrees across three markets and fifteen years: between 67% and 97% of intraday traders lose money. But the cause is not that markets are unpredictable. The retail trader's gross result hovers around zero; what sinks it is cost, and cost scales with frequency. A group does win persistently — it is under 1%.
What does "it doesn't work" actually mean?
Before looking at a number you have to take the sentence apart: "day trading doesn't work" can mean five things, and they do not carry the same evidence.
| The claim | Evidence |
|---|---|
| Most people who try it lose money | Very strong |
| Costs make it very hard to finish in the black | Very strong |
| Experience alone does not turn a loser into a winner | Strong, and measured in forex |
| Nobody can develop an intraday edge | Not demonstrated |
| Winning consistently is impossible | Not demonstrated |
The first three are backed by data covering entire markets; the last two are exactly what the video of the week tends to claim, and the ones no study supports. Separating them is half the work.
What do the studies actually say?
Brazil. Chague, De-Losso and Giovannetti went through CVM (Comissão de Valores Mobiliários, the securities markets regulator) records for 19,646 people who started trading mini-Ibovespa futures between 2013 and 2015, focusing on the 1,551 who persisted for more than 300 trading days — the ones who genuinely tried.
| Of the 1,551 who lasted | Share |
|---|---|
| Lost money | 97% |
| Earned more than the Brazilian minimum wage | 1.1% |
| Earned more than a bank teller's starting salary (~$54/day) | under 1% |
The best of the 1,551 made $310 a day — with a standard deviation of $2,560. It is not enough to ask whether anyone won: you have to ask how much, for how long, and at what risk.
Taiwan. Barber, Lee, Liu and Odean went through 3.7 billion transactions between 1992 and 2006. Day traders lost an average of 23.9 basis points per day net of fees, and the aggregate result was negative in 14 of the 15 years. Survival tells the same story: 44% were still trading after one year, 24% after two, 15% after three.
The regulators. The US CFTC (Commodity Futures Trading Commission) puts it bluntly for forex: two out of three retail foreign exchange traders end each quarter in the red. In Europe, ESMA's (European Securities and Markets Authority) mandatory warning comes from a measured range of 74% to 89%.
Why is "90% lose" a number you shouldn't repeat?
Because it doesn't exist. No study says 90%. And one regulator saying 67% while another says 89% is not a contradiction: they are not measuring the same thing.
| Figure | Who publishes it | What it actually counts |
|---|---|---|
| 67% | CFTC | forex accounts, over one quarter |
| 74-89% | ESMA | leveraged CFD accounts |
| 97% | Brazil (academic) | people who lasted 300+ days |
The longer the window and the more filtered the population, the worse the number gets: exactly what you would expect from a cumulative problem. It is one.
Where exactly does the money go?
Here is the finding almost nobody quotes. In Taiwan, before fees, day traders lost about 7 basis points per day. Gross, the result was essentially neutral. With costs it drops to −23.9. Friction triples the loss.
That is not a quirk of one market. Barber and Odean had already measured it across 66,465 US households between 1991 and 1996: risk-adjusted returns fall monotonically as portfolio turnover rises.
| Portfolio turnover | Annual return |
|---|---|
| The most active traders | 11.4% |
| The market | 17.9% |
Same market, same information, same people. The only thing that changes is how often they press the button. That, in one line, is why beginner traders lose money even when their analysis is sound.
It is not a niche opinion either. FINRA (Financial Industry Regulatory Authority) Rule 2270 requires US brokers to hand clients a disclosure that says precisely this: frequency generates costs capable of significantly reducing any profit. And that money does not evaporate: it ends up with the intermediary, which is what makes retail speculation a negative-sum game after costs. Which is why understanding the spread is not a beginner's footnote, but the variable that decides the experiment.
What does trading five times a day really cost?
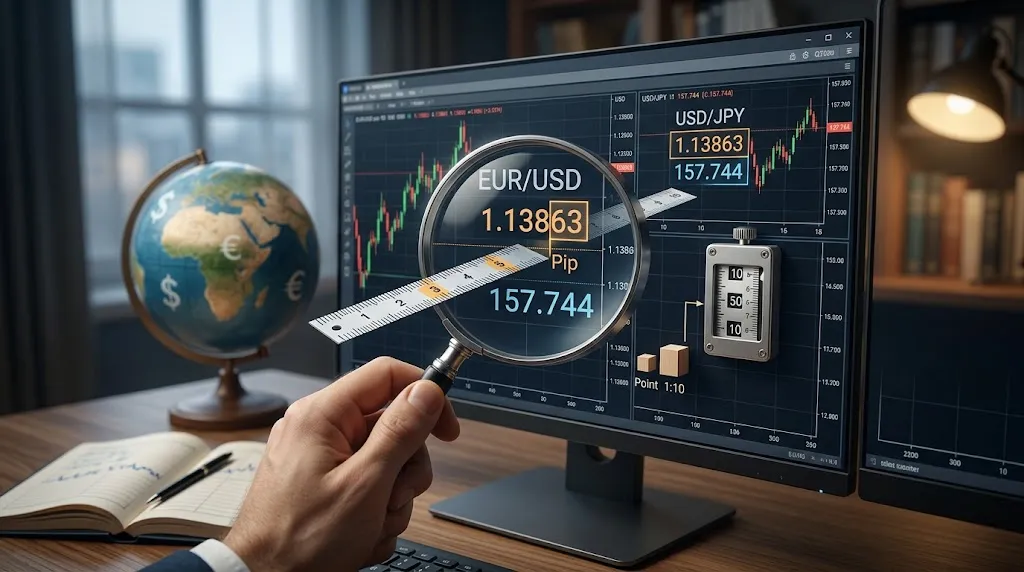
Put numbers on it. A $5,000 account, EUR/USD, 0.20 lots — $2 per pip. Assume an effective round-trip cost of 1.0 pip; the real number depends on your broker, the pair and the hour.
| Step | Calculation | Result |
|---|---|---|
| Cost per trade | 1.0 pip × $2/pip | $2 |
| Five a day, 20 days a month | 100 trades × $2 | $200/month |
| On a $5,000 account | 200 ÷ 5,000 | 4% a month |
| Over a year | 4% × 12 | ≈ 48% |
To finish the year at zero, your gross result has to be +48%. And the Taiwan data says the average day trader's gross is slightly negative.
Now change one thing: the frequency. Same size, same spread, same strategy.
| Pace | Trades per month | Annual cost in spread alone |
|---|---|---|
| Five a day | 100 | 48% |
| One a day | 20 | 9.6% |
The bar you have to clear just dropped by 80% without you becoming a better trader. This is the Barber and Odean curve translated into your account. And I haven't even added commissions, swaps, or the spread widening in the bad hours, all of which make the left side of the subtraction worse.
So does anyone actually win?
Yes, and it is measured. The same team that documented the Taiwanese wreckage published The Cross-Section of Speculator Skill, and found real persistence in the period after the one used to rank them.
| Group | Gross per day | Net per day |
|---|---|---|
| The top 500 | +61.3 bps | +37.9 bps |
| The bottom ranks | −11.5 bps | −28.9 bps |
That is not luck; luck does not repeat by cohort. The problem is the size of the group: under 1% wins predictably and sustainably net of fees. Which is why the honest conclusion is not "day trading doesn't work" — it is that it works for a minority so small that assuming you are inside it is a bet, not a career.
What changes in your trading if you accept this?
Three concrete things, and none of them is "stop trading".
Treat frequency as a risk parameter. The same way you already fix position size, fix a maximum number of trades per day and treat it as a hard limit. It is the only variable in the equation you control completely.
Work out your annual cost before your annual target. Multiply spread × size × expected trades per year and divide by your capital. That percentage is your real break-even. If it comes out above 30%, your strategy is not the problem.
Track gross and net separately in your journal. If your gross is positive and your net is negative, you do not have an analysis problem: you have a cost problem, and frequency is the lever you control. It is fixable in an afternoon. The trading journal is where that distinction becomes visible, and almost nobody writes it down.
Three ways to read this data wrong
Mixing the figures. The CFTC's quarterly 67% and Brazil's three-year 97% do not contradict each other: they do not measure the same thing. Anyone using them interchangeably is selling fear, not information.
Believing that persistence teaches. The Brazilian study looked for evidence of learning and found none. In forex it has been measured more finely still: Hayley and Marsh followed retail FX traders and also found no sign that they learned to trade better over the years; the most seasoned even showed a slight decline once you correct for who quits. The only thing they learned was about themselves: after a bad day they traded less, smaller and less often. In other words, they reached this article's conclusion the hard way. Lasting is not improving, and risk of ruin does not negotiate with willpower.
Reading that 1% as an invitation. That measurable skill exists says nothing about your personal odds of having it. It is exactly the lie that costs beginners most, wearing academic clothes.
The market doesn't charge you for being wrong. It charges you for trading.
The sources
All four, in full and checkable, because an article that tells you to go to the register yourself cannot ask you to take its own word for it:
- Chague, F., De-Losso, R. and Giovannetti, B. (2020). Day Trading for a Living? — SSRN 3423101.
- Barber, B., Lee, Y.-T., Liu, Y.-J. and Odean, T. (2014). The Cross-Section of Speculator Skill: Evidence from Day Trading. Journal of Financial Markets, 18, 1-24 — PDF.
- Barber, B. and Odean, T. (2000). Trading Is Hazardous to Your Wealth: The Common Stock Investment Performance of Individual Investors. The Journal of Finance, 55(2), 773-806 — PDF.
- Hayley, S. and Marsh, I. W. (2016). What Do Retail FX Traders Learn? Journal of International Money and Finance, 64, 16-38 — open access.