What does "following the money" mean in forex?
The advice is good and almost everything sold under that name in forex cannot be seen. Spot has no central exchange, so there is no real volume and no tape. Here is the money you can actually follow: public, free and delayed.
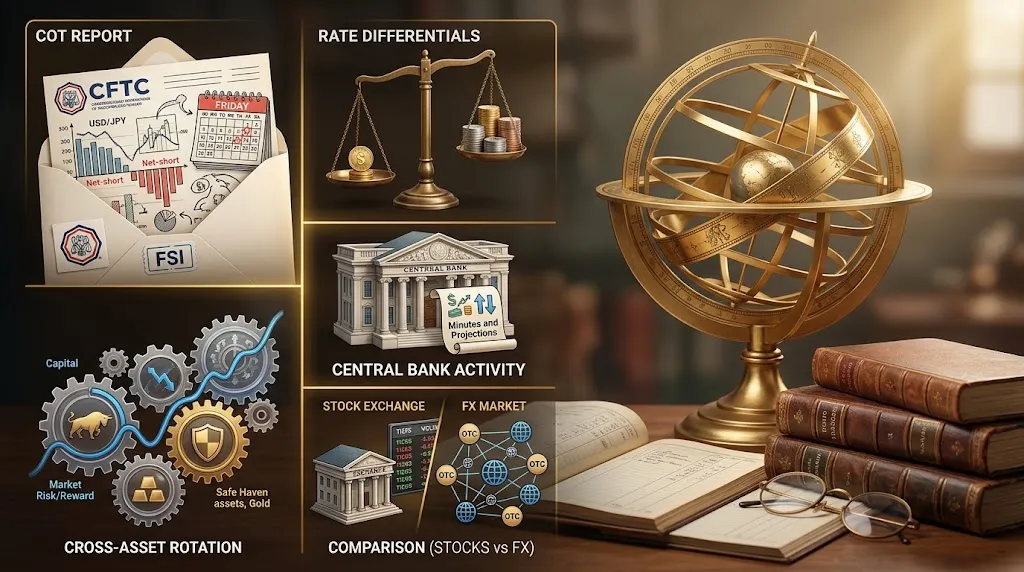
"Follow the money" is good advice, and almost everything sold under that name in forex cannot be seen. Spot FX has no central exchange, so there is no public record of who bought and who sold. What does exist is a handful of official, free, delayed sources. They are boring, and that is exactly why they work: nobody reads them.
Why does this work in stocks but not in forex?
When someone says they follow the money in the stock market, they mean concrete things. Exchanges record every trade and publish consolidated volume. There is an order book. There is a tape. Large funds disclose their holdings quarterly, and insiders disclose their purchases within days.
Spot forex has none of that. It is a decentralised market: when you trade, your broker is your counterparty, and that trade is recorded nowhere public. The "volume" on your platform is your broker's tick count, not the market's. Two brokers will show you two different volumes for the same candle.
This is not a minor technicality. It is why the tools that make the phrase true in equities — footprint, delta, Time & Sales — do not travel to your currency pair. We cover this in why forex has no order book.
What money can you actually see?
Four sources. All public, all free, all delayed.
| Source | Who and when | What it tells you |
|---|---|---|
| COT report | CFTC, every Friday | net position of leveraged funds |
| Rate differentials | central banks, per meeting | where holding money pays more |
| Minutes and projections | central banks, per meeting | where they are heading before they move |
| Cross-asset rotation | market, continuous | whether capital flees or chases risk |
The COT report (Commitments of Traders) is the most direct: the CFTC (Commodity Futures Trading Commission, the US derivatives regulator) requires large participants in currency futures to declare their positions and publishes every Friday how many contracts leveraged funds hold long and short.
It helps to know the scale. Spot trades $3 trillion a day, according to the April 2025 Triennial Survey from the BIS (Bank for International Settlements, the central banks' bank). CME (Chicago Mercantile Exchange) currency futures, the ones the COT covers, move around 3% of that. So the COT does not show you the market: it shows you the corner of the market where disclosure is mandatory. The same funds trade both.
Rate differentials are the oldest engine in forex: if one currency pays more than another, capital tends to move toward it. That is what the CTS measures.
And correlation between pairs gives rotation away: when the yen and the franc rise as indices fall, that is not coincidence, it is money changing seats.
What does this look like in a real case?
In late July 2026, leveraged funds were heavily short the yen: 101,990 net contracts on 28 July, according to the COT. It was not their peak — they had reached 115,400 on 30 June — but they had spent three weeks loading up again: 90,461 on 14 July, 96,185 on the 21st, funding cheaply in yen to buy currencies that paid more.
That figure was published on Friday 31 July at 3:30 pm New York time. What happened next:
| Date | Net position | USD/JPY |
|---|---|---|
| 28 Jul | −101,990 | 163.93 |
| 31 Jul | (release) | 160.26 |
| 3 Aug | — | 156.74 |
| 4 Aug | −60,825 | 157.48 |
In one week they closed 40% of the position. The pair fell from 163.93 to 156.74: 719 pips in four sessions.
Now the honest part, the one almost nobody tells: by the time the figure was published, the fall had already started. On 31 July the pair was already at 160.26. The COT did not give you the timing. What it gave you, three weeks ahead, was the size of the position that had piled up.
Positioning tells you how much fuel is in the room. It does not tell you when the spark arrives.
What gets sold as "following the money" and isn't?
Three things worth recognising:
Indicators that promise to show you institutional flow in real time. The data they claim to read does not exist. We said as much in smart money and liquidity: what is true — nobody in retail sees real institutional flow; it is inferred, late and noisy.
Your platform's volume presented as the market's volume. It is your broker's. It is useful for relative activity within a session, not for how much money came in.
The idea that retail loses by watching price instead of money. It is a pretty explanation and it is not the one the data supports: the problem is cost multiplied by frequency, not a lack of privileged information.
How does ForexCommand measure these flows?
With both halves, because they are different signals and sometimes opposite ones.
The FSI incorporates institutional COT positioning normalised over 52 weeks, weighted at 25%. It answers "is this currency at a historical positioning extreme?".
The MRS uses aggregate retail sentiment, and uses it backwards: when the crowd is heavily loaded one way, that scores as a contrarian signal, not as confirmation. It is 10 of the 100 points.
Institutional with you, retail against you. Neither is a crystal ball, and both are published late. But they are real data, and that already puts them ahead of any indicator promising to show you what big money is doing right now.
Price is the consequence. Money is the cause — but the cause is published on Fridays, not in real time.