What was the taper tantrum?
In 2013 the Fed only hinted it would slow its bond buying, and the 10-year yield jumped from 1.66% to 2.98%. What was the taper tantrum, and why did the rupee lose 22%?
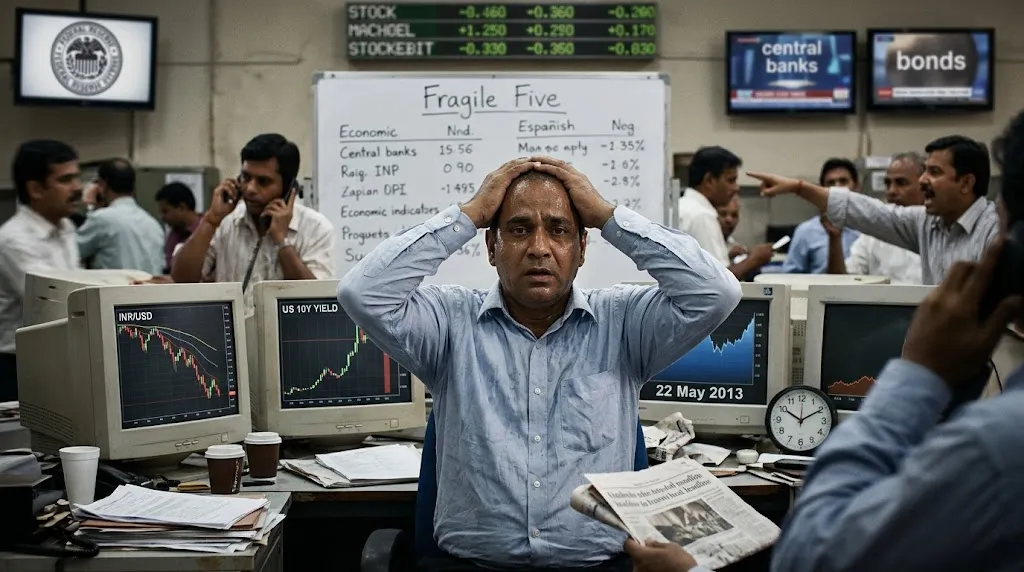
On 22 May 2013, Federal Reserve Chair Ben Bernanke told the US Congress that the Fed could slow its bond buying "in the next few meetings". The Fed did not buy a single bond less in 2013. Yet by early September the 10-year US Treasury yield had climbed from 1.66% to 2.98%, and at its worst, on 28 August, the Indian rupee had lost 22% of its value against the dollar. That reaction is what markets call the taper tantrum.
What did the Fed actually say?
In 2013 the Federal Reserve was buying $85 billion of bonds a month: $45 billion of longer-term Treasury securities and $40 billion of mortgage-backed securities. It was its third round of quantitative easing (QE). Slowing those purchases is called tapering: the balance sheet keeps growing, only more slowly.
Three dates built the episode:
| Date | The Fed's words | 10-year yield that day |
|---|---|---|
| 22 May 2013 | Bernanke, testifying to Congress, said that if the economy kept improving, "in the next few meetings, we could take a step down in our pace of purchases" | 2.03% |
| 19 June 2013 | After the Federal Open Market Committee (FOMC) meeting, Bernanke said that "if the incoming data are broadly consistent with this forecast", it "currently anticipates" moderating the monthly pace later in the year and "ending purchases around midyear" 2014 | 2.33% |
| 18 September 2013 | The FOMC kept buying $85 billion a month and decided "to await more evidence" before adjusting the pace | 2.69% |
None of the three changed a purchase. They changed what the market expected the Fed to do next.
What did the market do?
The 10-year Treasury yield was 1.66% on 1 May and 2.98% on 5 September, its highest close before the September meeting: 132 basis points in four months. The currencies that paid for it were those of countries that depended on foreign money:
| Currency | 1 May 2013 | Weakest point by mid-September | Value lost against the dollar |
|---|---|---|---|
| Indian rupee | 53.65 per dollar | 68.80 (28 August) | 22.0% |
| Brazilian real | 2.0065 per dollar | 2.4464 (22 August) | 18.0% |
| South African rand | 9.0201 per dollar | 10.408 (27 August) | 13.3% |
It was not a broad dollar rally. The Fed's index of the dollar against a wide basket of currencies rose about 4% from 1 May to its peak on 5 July. The sell-off was concentrated in a handful of currencies rather than across everything the dollar trades against.
Why were those currencies hit?
On 1 August 2013, Morgan Stanley's currency research team published a section of its FX Pulse report by strategist James Lord titled "EM Currencies: The Fragile Five", EM standing for emerging markets: the Brazilian real, the Indonesian rupiah, the South African rand, the Indian rupee and the Turkish lira. Institutional Investor later summed up the grouping as "five emerging markets beset by current-account deficits and with a heavy reliance on foreign capital inflows."
A current-account deficit means a country spends more abroad than it earns there, and someone has to finance the gap. While US yields sat near record lows, investors were willing to lend at the higher yields those countries offered, the same logic that drives the carry trade. When the Fed hinted it would buy less and US yields rose, that trade lost part of its reason to exist.
What happened when the taper finally came?
On 18 September the Fed surprised the market by not tapering. The 10-year yield closed the announcement day at 2.69%, down from 2.86% the day before. The next day, in the first noon reading after the announcement, the dollar bought 61.76 rupees, down from 63.37.
On 18 December the Fed did it: from January it would buy $40 billion of Treasuries and $35 billion of mortgage-backed securities a month, $75 billion in all, instead of $85 billion. The rupee barely moved: 62.06 per dollar in the noon reading before the announcement, 62.14 in the first one after it and 61.92 at the end of the year. The real damage had been done months earlier, when the market first started pricing a taper that had not happened yet.
What can a trader take from it?
- A sentence can move more than a decision. The Fed bought the same $85 billion a month from May to December. What moved currencies was the change in expectations, which is why central banks prepare the ground before they act, as our explainer on Jackson Hole shows.
- Tapering is not tightening, but markets can trade it as if it were. Our explainer on QE and quantitative tightening (QT), linked above, draws the line between them; in 2013 the market did not wait for it.
- Watch the long end of the curve. The 10-year yield, not the policy rate, carried the message: the Fed's target range stayed at 0% to 0.25% all year. More in our guide to the yield curve and real yields.
- This piece does not say what a taper would do today. Each episode starts from different deficits, different yields and different positioning; 2013 is one case, not a rule.
The 10-year yield is the Federal Reserve's daily constant-maturity series (DGS10); exchange rates are the Fed's noon New York buying rates (H.10: DEXINUS, DEXBZUS, DEXSFUS) and the Fed's broad index of the dollar is DTWEXBGS, all via Federal Reserve Economic Data (FRED), as is the federal funds target range (DFEDTARU, DFEDTARL). The H.10 release does not cover the rupiah or the lira. The 19 June, 18 September and 18 December wording is from the Fed's press conference transcript and FOMC statements; the 22 May quote is as The Global Treasurer reported it the next day. The "Fragile Five" note is Morgan Stanley's FX Pulse of 1 August 2013, as cited by Barry Popik's archive, and the summary of the grouping is Institutional Investor's (January 2014).