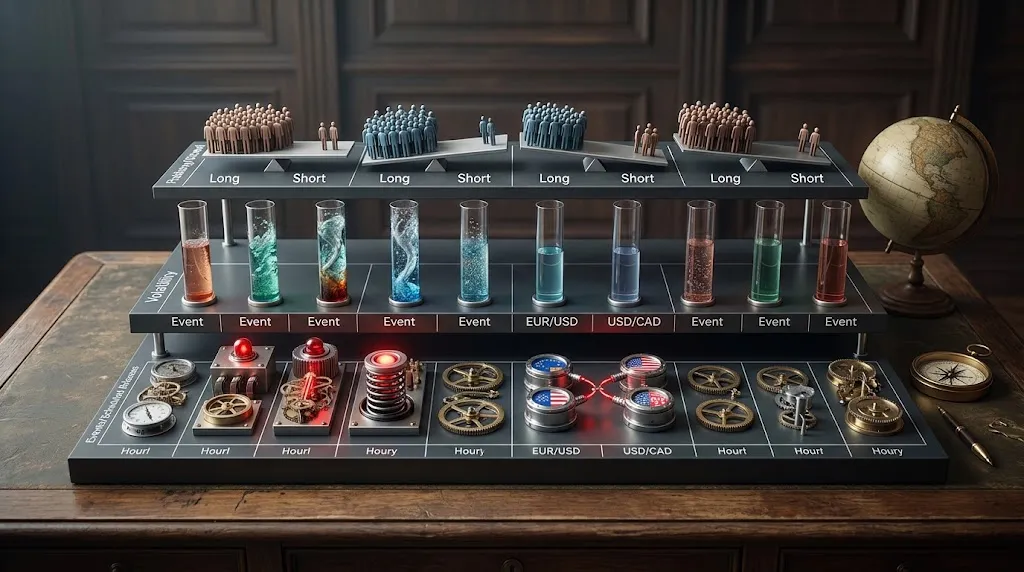
Fed hike odds vs the dot plot vs Fed guidance: three reads of the same decision
Fed funds futures, the dot plot and Fed speeches answer the same question in different ways. We explain what each one measures and what they said about October.

On 14 October a hotter US core inflation report pushed the market's odds of a Federal Reserve hike at the October meeting above 40%, according to Action Forex. After the close, FXStreet reported that San Francisco Fed President Mary Daly saw further hikes as probably needed, but none in October.
And the Fed's own dot plot still showed what it had shown since September: one more hike this year. Three gauges, one question, three different answers — and each one is right about something different.
This explainer covers what each gauge measures, who produces it, how often it changes, and how to read them together when they disagree, which happens often.
Three gauges, one question
All three try to answer the question every dollar trader is pricing: what will the Federal Reserve do with its policy rate, and when?
| Fed funds futures | Dot plot | Fed guidance | |
|---|---|---|---|
| Who produces it? | The market, through prices | Federal Open Market Committee (FOMC) participants | Fed officials, in public |
| What is it? | A bet with money behind it | Each official's projection | Words: statements, press conferences, speeches |
| How often does it change? | Every trading minute | Four times a year | At every speech, except in the blackout |
| What does it answer best? | When does the next move come? | Where do rates end up? | How do officials read the data? |
Fed funds futures: what the market is betting
A fed funds futures contract settles on the average effective federal funds rate for its month, and its price is quoted as 100 minus that rate, as the New York Fed's Liberty Street Economics explains. A contract priced at 96 implies an average rate of 4%. Compare the rates implied by the contracts around each meeting and you get the market's expected move.
Tools such as CME Group's FedWatch turn those prices into a probability for each meeting outcome. The same New York Fed note adds a caveat: implied rates include a term premium, so they are not pure expectations.
What makes the futures valuable is speed. Here is how the odds of an October hike moved after the Fed raised rates on 16 September, as reported in our own coverage:
| Date | October odds | Reported by | Context |
|---|---|---|---|
| 24 September | 77.5%, from roughly 53% a day earlier | Action Forex | The week the 10-year US Treasury yield hit a 19-year high |
| 2 October, before payrolls | About 28% | investingLive | Morning of the September jobs report |
| After payrolls, 2 October (weekly review) | 77.9% for a pause (not a hike) | Action Forex | 29,000 jobs against 90,000 expected |
| 5 October | 17.7% | Action Forex | First session of the next week |
| 14 October | Above 40% | Action Forex | Core inflation came in hotter than expected |
That is a swing from more than three in four to less than one in five and back above two in five, in three weeks, without the Fed doing anything. The futures are the gauge that reacts to every data point, and that is also their weakness: they move on the latest number as much as on the path of monetary policy.
The odds above come from different trackers, as each outlet reported them. Two trackers can disagree by a few points on the same day, so compare a number with the same source's previous reading, not with another outlet's.
The dot plot: what officials project
The dot plot is the chart inside the Fed's Summary of Economic Projections (SEP), where each FOMC participant marks where they think the policy rate should be at the end of each year. It is published four times a year, alongside the March, June, September and December decisions.
When the Fed raised its target range by 25 basis points to 3.75–4.00% on 16 September, the median of the officials' projections pointed to one further hike in 2026 and put the end-2026 rate at 4.1%. That is the latest dot plot, and there will not be another until December.
So the dot plot did not move while the futures went from 77.5% to 17.7% and back above 40%. That is not a flaw; it is what the dot plot is for. It tells you where the committee thinks rates are going, not which meeting gets there.
Fed guidance: what officials say
Guidance is everything the Fed communicates in words: the policy statement, the chair's press conference and the speeches and interviews in between. It is the hardest gauge to quantify, and it can change the reading of the other two, because it tells you how officials are interpreting the data the futures just priced.
Three officials framed October in three ways over the same period, according to the sources in our coverage:
- 24 September. New York Fed President John Williams called another increase this year "reasonable", without committing to October.
- After the September jobs report. Action Forex's weekly review quoted Chicago Fed President Austan Goolsbee saying both a pause and another hike remained possible, and that inflation, not the labour market, was still the central problem.
- 14 October. FXStreet reported that San Francisco Fed President Mary Daly saw further hikes as probably needed, but none at the October meeting.
None of them contradicts the dot plot. Each one shades the timing, and that is the part the futures trade.
Guidance also has a calendar. The Fed's blackout begins on the second Saturday before each meeting and ends on the Thursday after it, as the St. Louis Fed's published schedule shows.
For the 27–28 October meeting that runs from Saturday 17 October to Thursday 29 October. From the 17th until the decision, no official guidance arrives, and the futures move on data alone.
When they disagree, which one should you trust?
None of them on its own. They disagree because they answer different questions, and the disagreement is information.
Action Forex's weekly review, quoted in our wrap of 3 October, put it in one line: markets took October off the Fed's table, not rate hikes. In the pricing it cited, the most likely December outcome was still one more 25 basis point increase, to 4.00–4.25%, at 67.3%. And on 5 October, the session in which the October odds sank to 17.7%, Action Forex said the market still priced an 82.7% chance of at least one more hike by December, as reported in our roundup of that session.
Read together, the three gauges agreed on the destination and disagreed on the date:
- Destination. The dot plot's one more hike, the futures' December pricing and Daly's "further hikes" all pointed the same way.
- Timing. The futures swung on each data release; the officials hedged; the dot plot stayed silent.
How do you use all three?
- Before a data release, read the futures. They tell you what is already priced in, and the currency moves on the surprise against that, not on the number itself. In September the odds of a September hike went from 72.4% to 88.7% after the August inflation report, and five days later the Fed delivered it, as our headline vs core inflation explainer recounts.
- Use the dot plot as the anchor. When the futures price a path the dots do not support, one of the two has to give. The dots can go stale between releases, and the futures can swing on a single data point, as they did this October.
- Read guidance for changes, not for headlines. An official repeating the median is not news; one moving away from it, especially a voter, is. Whether a remark lands as hawkish or dovish depends on what was priced before it.
- Mark the blackout on your calendar. During the blackout before a decision, the futures are the only gauge still talking.
What this explainer does not give you
It is not a forecast for the October meeting, and none of the three gauges is one either. The odds quoted here are the ones our sources reported on each date, not live readings, and we do not run our own futures feed. For how the decision itself is announced and scheduled, see our explainer on the FOMC rate decision.